NOVA Del 2013 = V339 Del
An amateur spectroscopic survey of a bright classical CO Nova
|
|
NOVA Del 2013 = V339 Del An amateur spectroscopic survey of a bright classical CO Nova |
||||||
|---|---|---|---|---|---|---|---|
| - 1 - |
The fire ball and optically thick phase
From 14-08 to 22-08-2013Strong Balmer and Fe II lines with P Cygni profiles
First appearence of [O I]
Main features and evolutions
Blue continuum fading
Balmer and Fe II lines with P cygni profiles
First appareance of [OI]
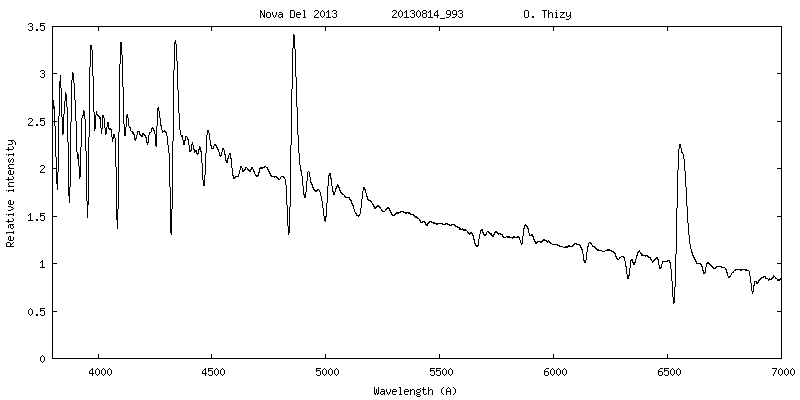
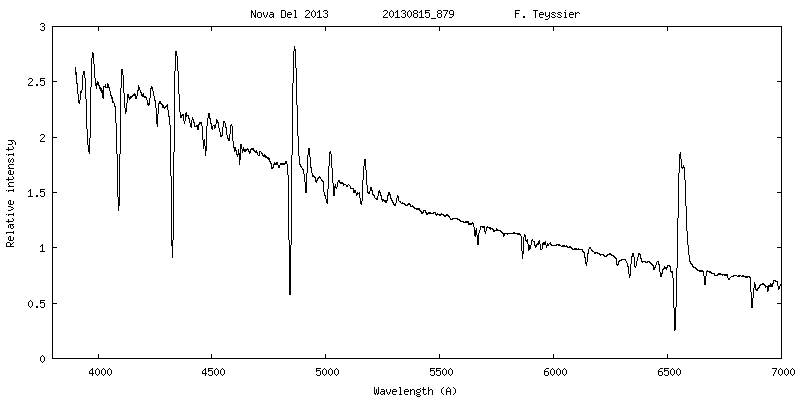
Discovery 14-08-2013 The fire ball stage
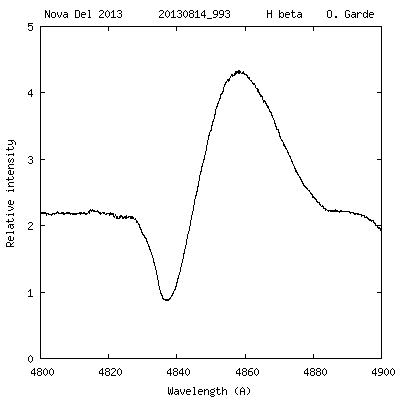
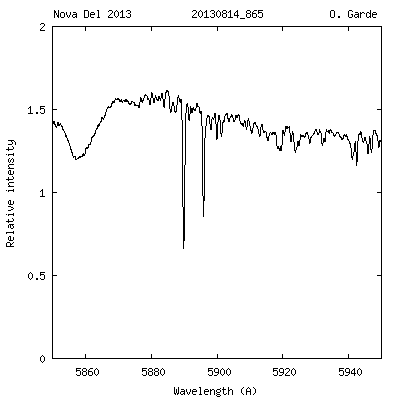
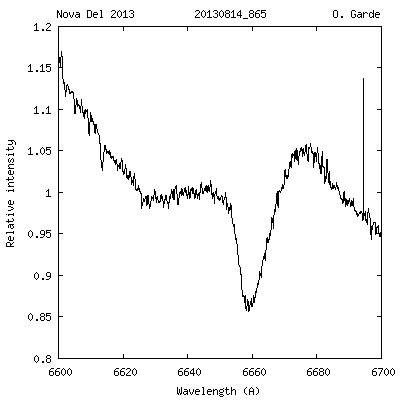
Olivier Thizy - Alpy600 - R = 650
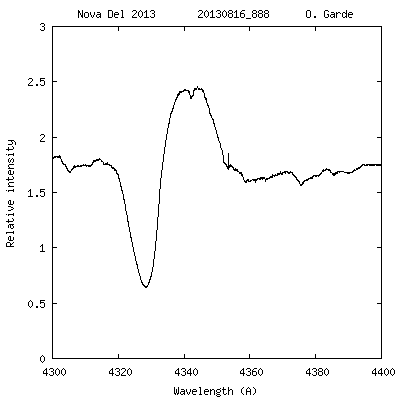
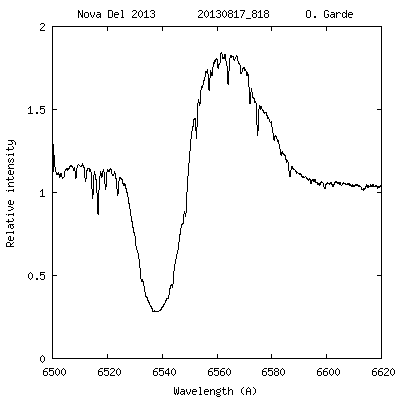
Oliver Garde - eShel - R = 11000
The first spectra show clearly a nova type Fe near its maximum luminosité, with narrow balmer liens, Fe II lines, noticelly multiplet 42. Most of the lines shows a P Cygni absorption.
" strong H-alpha emission with a P Cyg profile extending to a maximum radial velocities of -2300 km/s (absorption, EW approx 8.1A) and +2400 km/s (emission, EW \approx 52.9A) with no terminal edge at high negative velocity. The emission is broad, asymmetric (stronger blueward) and now structureless. The He I 6678 appears to show a detached absorption feature at -870 km/s without strong emission. In contrast, He I 5875 shows a strong P Cyg line with velocities similar to H\alpha. Both components of Si II 6347, 6371 (RMT 2, see Williams, R. E. 2012, AJ, 144, 98) are present in absorption with vrad \approx -1100 km/s; Fe II 6456, and N I 6486 also appear to be present with vrad \approx -1100 and -960 km/s, respectively. The spectrum is typical of a classical nova -- possibly CO type -- in the early (optically thick) fireball stage but with indications of the onset of the recombination event (e.g. Shore et al. 2012, A&A, 537, C2) , based on weak displaced broad absorption from the Na I D lines. The interstellar components of Na I D are not saturated, suggesting the extinction is relatively low "
ATel# 5282, S. Shore & al., 2013
H alpha H beta H gamma Na I D lines and He I 5875 strong P Cygni profile Si II 6347 and 6371 strong absorptions He I 6678
Comments nova phenomenon and lines evolution by Steve Shore First, this is a stage not often accessed in the optical, even less in
the ultraviolet. In the first stage, after the explosion (that we
don't see), the ejected outer layer of the white dwarf expand
hypersonically and cool. Two things. First, this is a mixture of the
stuff that was accreted on the WD during the pre-nova stage, when it
sits inside an accretion disk from the companion and like a garbage
disposal just accumulates the stuff. Once a sufficient pileup occurs,
the compressed layer can initiate nuclear reactions and explode (well,
this is the surface, not the center, so there's nothing to constrain
the event). BUT there's a question even here. The ignition of the
nuclear fuel is like a flame, in fact physically it's very close, and
propagates like a flame through the envelope. This, in turn, provokes
a buoyant mixing (to avoid the word "boiling" but it's a similar thing)
that also dredges material from deeper layers. A major uncertainty, of
almost cosmological importance, is how much of that mixed matter is
blown off and whether the WD mass increases or decreases. But that's
for another time.For this stage, the explosion throws the gas off like a shell but with
a catch, the velocity depends on radius because the range of velocities
is ballistic and within an interval from the escape velocity to
whatever can be reached by the energy of the explosion. So you will
see velocities up to thousands of km/s. On this, a word of caution.I'll always, in any of these notes, emphasize that what you see is NOT
the whole story. The ejecta are not completely transparent at all
wavelengths and you see to different depths of this fog -- just like a
fog -- depending on whether you're in the lines, continuum, the optical
or UV or IR -- in other words, a radiographic image of a human is
similar. You see to the depth from which the light can escape to you,
the surface -- the "photosphere" to those who want to be technical --
is wavelength dependent.The same with the velocities. You see different line profiles on, for
instance, each Balmer line. Since the sequence from H-alpha to beta
and so on is also one of intrinsic opacity (strength) you see deeper
in H-gamma than H-alpha and the line is formed mainly ("weighted
toward") the inner ejecta. So the combined line profiles, viewed in
velocity, are the probe -- tomography -- of the ejecta. With this you
can look for structure, dynamics, even variable abundances. The trick
is following the sequences and seeing how each part of the spectrum
develops. The Fe lines appear because the UV is opaque and the
absorption at high energy excited the optical (low energy) lines. The
same for the He and Balmer lines.In all cases, the classes (Fe, He/N) are not anything but descriptive of this stage.
The spectra you all got last night were from the fireball, the initial
stage of the expansion that is hard to catch. Now you'll see the next
pass, as the ejecta start to recombine and turn into a dense "fog".
Then, as they thin out (weeks from now, likely) the emission will
appear again but in the first stage the lines pass from ionized and He
and H to those of more easily ionized heavy metals that would have been
too ionized to observe in the fireball.
The line profile is a map of the velocity with depth in the ejecta and also in 3D.
A sphere at any opacity has a different profile than a bipolar ejection. A sphere, for instance, always has material moving transversely to your line of sight, a bipolar ejection doesn't.
A central source illuminating a sphere has its photons always intercepted, a nonspherical ejecta doesn't, some photons can escape without any effect whether emitted centrally or within the ejecta themselves. So the intensity at any radial velocity (with respect to the observer) maps into a position in the ejecta (but differently depending on the geometry).
We know this from resolved ejecta but also from, for instance, T Pyx 2011 and V959 Mon 2012. Some of this is indicated by the ratio of the emission on the profiles compared to the absorption. You can have pure emission with no absorption for bipolar ejecta oriented at large inclination relative to the observer or only displaced absorption if the opposite holds.As the ejecta expand, the density drops throughout regardless of the geometry. The part in emission increases at first because it's less dense and less opaque. The velocity difference within the ejecta adds to this, the periphery has the highest velocity so its absorption is shifted relative to the inner part. At first, if the ejecta don't recombine, the absorption zone should move inward toward higher density and lower velocity while the emission increases. That's what we're now seeing but there is a start of the recombination indicated by the Na I D lines and the O I 8446 lines. This will stop once the ejecta start again to turn very opaque, we're still in the transition phase you see after a nuclear explosion when the fireball seems to be shrinking.
But unlike the nuclear tests, this is not the static atmosphere but the debris itself that is changing. As the ejecta get more opaque there should be absorption components appearing on all of the emission lines and these should seem to move outward (toward more negative radial velocities) as the wave moved toward the outer regions. At the same time, the ionization will change and the lower metallic ions (e.g. Fe II) will get stronger. You've now seen that starting. Then what happens isn't just a temperature effect. The optical depth (the relative opacity) will continue to decline after total recombination and the matter will start to ionize again.
Before all hat happens, there's one more -- very brief -- phenomenon of importance. If the density is high enough and the kinetic (gas) temperature low enough, meaning about 5000 K or lower -- the gas can form molecules. The most stable are simple radicals like CO, CN, and CH. In ONe nova, the dust forming DQ Her 1934, CN was observed just about now relative to the start of the outburst, it lasted for about a week starting a bout 6a week after the detection. That's where we are.
I have no idea whether this will happen here, but if it does then this will form dust in about 100 days by mechanisms I'll try to explain soon (it's beyond your patience and a bit too far in the future for the moment, I hope you won't mind).
Never forget that the main difference between a nova and supernova in this regard is the survival of the WD. It is a hot, radiating source that ionizes the ejecta from the inside out (just like a planetary nebula in fast forward!) so the inner region -- the moving photosphere
-- starts to get hotter and radiate more in the UV. This drives further ionization of the overlying layers and in time, the ejecta completely reionize. That's when the emission lines suddenly appear and there is no more optical absorption, the so-called nebular stage.
When this happens depends on how rapidly the density drops, hence on the velocity and mass of the ejecta and the luminosity of the WD. In Del 2013, we don't know that yet. But once the ejecta are completely transparent, the line profiles give you a complete view of the
structure even before the remnant becomes resolvable (if ever)
15-08-2013 The rise toward maximum
François Teyssier -Lisa - R = 1000
Oliver Garde - eShel - R = 11000
ATel#5291 Tarasova & al., 2013
The spectra display that Nova Del 2013 is still in the fireball stage as mention Darnley et al. (ATEL 5279) and Shore et al. (ATEL 5282). The spectra contain the strong emission lines of Balmer series exhibiting PCygni profiles with velocities (Halpha ~ -1400 km/s, Hbeta ~ -1200 km/s, Hgamma ~ -1120 km/s, Hdelta ~ -960 km/s) and strong FeII lines of 40, 42 multiplets, medium FeII lines of 37, 38 multiplets with also P Cygni profiles (RV ~ -900 km/s).
H alpha H beta H gamma
Fe II (42) lines 4924 5018 5169 Fe II lines (27,37,38)
Comments about velocity by Steve Shore The terminal velocity of the line profile is an absolute thing,
relative to the rest , not the separation of maximum and
minimum (you see that described, too often, in the older photographic literature). So you're right in saying that there's been a change but it's mainly in the shape and minimum of the absorption. You'll notice that in the last profile the absorption has changed shape, this is the sort of thing some models predict for the evolution as the ejecta expand since the different layers have different temperatures and densities along with different velocities. You never see this sort of thing in winds unless they're very collimated (and that's rare enough).
Instead, the decrease is when the line is formed deeper in. Remember, this was very hot and not that it's cooling the optical is becoming less opaque. This is a part of the spectrum where there are few absorbers, the main opacity sources are scattering and thermal (and the photosphere down to which you're seeing -- or rather a moving opaque surface). The timescale for the changes is consistent with the column density varying as 1/t^2 and the optical depth varying as 1/t. So you would expect that (since the intensity depends on the exponential of the optical depth) that the line intensity at any velocity should vary
as
I(vel) ~1- exp [- (t0/t)]
where the time t0 is a scaling time. In other words, as the expansion causes the opacity to drop the intensity at a given velocity increases (decreased absorption). This will go on for a bit until the Fe lines appear, as they seem to be now starting to do.
Maximum : August 16.45 UT at V=4.3 mag (ATel #5297 Munari & al., 2013)
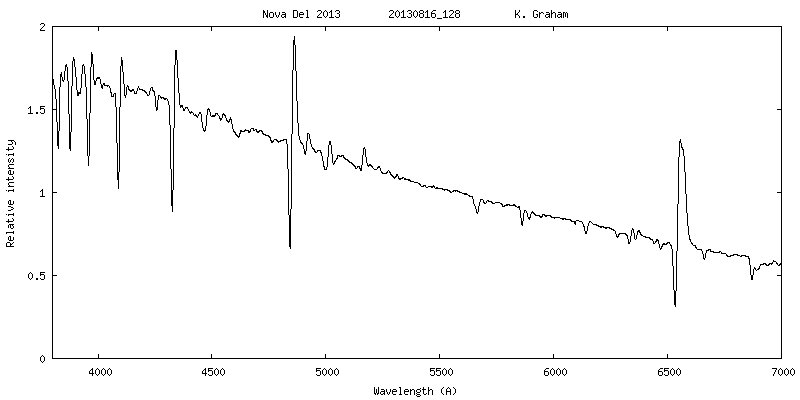
16-08-2013 The first decline
The first decine is unusual : A first very fast drop in luminsosity (ATel)
Keith Graham - Alpy600 - R = 650
Oliver Garde - eShel - R = 11000
ATel#5297, Munari & al.
Nova Del 2013 seems to have reached maximum brightness on August 16.45 UT at V=4.3 mag. It immediately entered the decline phase and it is declining pretty fast, of the order of 1 mag in a day, qualifying it as a very fast nova if the pace will be maintained on the coming days...
The strong CaII (3934, 3968) and NaI (5890, 5896) interstellar lines appear single component and have an heliocentric radial velocity of -2.6 +/- 0.2 km/s. The equivalent width of NaI 5890 is 0.3945 +/- 0.003 Ang, which corresponds to a reddening of E(B-V)=0.182 following the calibration by Munari and Zwitter (1997, A&A 318, 269). All strongest diffuse interstellar bands are readily visible: 5780 (equivalent width 0.136 Ang), 5797 (e.w. 0.014 Ang), 6196 (e.w. 0.010 Ang), 6203 (e.w. 0.048 Ang), 6614 (e.w. 0.024)
Our Echelle spectrum for Aug 15.83 shows a flat topped Halpha emission profile (confirming Tomov et al. ATel #5288), with - at best - only a feeble trace of a double peak; on Aug 14 the emission was trapezoidal in shape, on Aug 16 it turned into Gaussian profile; (3) HeI lines has weakened during the rise toward maximum: on Aug 14 they displayed a marked P-Cyg profile, on Aug 15 the emission component disappeared, and on Aug 16 also the absorption component vanished; (4) while the equivalent width of the absorption component of the P-Cyg profile of Balmer lines have remained essentially constant during the rise to maximum, that of emission component has steadily declined: for Hbeta it was -24.3 Ang on Aug 14.84, -14.6 Ang on Aug 15.83, -9.1 Ang on Aug 16.85 U
H alpha H beta H gamma
17-08-2013 The first decline
Halt post maximum
Max + 1 day
Mag ~ 5.0
Jim Edlin - LISA - R = 1000
Oliver Garde - eShel - R = 11000
ATel#5304 Munari & al., 2013
"Spectroscopically the plateau phase was characterized by a large reduction in the intensity of emission lines, with FeII and Hbeta almost vanished, and CaII H and K lines rivalling Halpha in terms of integrated flux. At the same time the absorption spectrum strongly increased in overall intensity, up to a point when the absorption lines where so strong and blended to make impossible to recognize the level of the continuum. The end of the plateau phase has been marked by the rapid vanishing of the absorption spectrum and a large increase in intensity of the emission line"
We estimate that maximum was reached on Aug 16.25 at V=4.3. The nova immediately bounced back from maximum and initiated the decline. The decline proceeded linearly at a rate of 0.6 mag/day for about 22 hours, until Aug 17.15 when it suddenly halted and the nova remained stable at V=4.85 until Aug 19.0 UT. The nova entered this 1.85 day long V-band plateau with a blue color, B-Ic=+0.70, and left it appreciably redder at B-Ic=+1.17. Following the plateau, the nova resumed the decline, this time at a slower 0.28 mag/day rate in the V band. Our latest measurement on Aug 20.817 UT reads B=5.78, V=5.37, Ic=4.52
H alpha H beta H gamma
Merged spectrum of 4 spectra obtained with a 600 l/mm grating - Paolo Berardi

The fireball stage by Steve Shore At the start of the expansion, at least when we see the nova visibly, the ejecta should pass through a stage called the fireball. This is an opaque stage that resembles a single expanding surface, or a sort of thin atmosphere, with an almost uniform temperature. Usually that isn't observed but in this nova it might have been caught. The expansion velocity is high enough that the matter can't radiate efficiently enough to cool by energy loss, the temperature drops instead because of the increasing volume at constant mass -- he energy density is dropping. This is the same as saying that the total energy remains almost constant but the temperature decreases. Then something important happens. When the matter gets cool enough, first the hydrogen and then heavier elements start to recombine. This releases some energy (from the excess energy of the electrons as they're captured by the ions) but mainly that the neutral and low ionization stages have much higher line (and continuum) opacities and the absorption in the ultraviolet increases quickly. The lines that absorb there are the ground state transitions; that is, they're the strong zero volt states. Their upper levels are those that both pump the absorption strength of the optical transitions and excite the levels to reradiate. So the Fe II spectrum, for instance, suddenly starts to appear. There are coincidences with some of the He I lines, e.g. He I 5016 is close to Fe II 5018, the same for He I 4923 being near an Fe II line (in these cases they're both from the same lower level). The lack, in the last spectra, of He I 5875 gives the game away: the triplet series (He I 7065, 5875, 4471) being absent means the stuff at the near-coincidences if Fe II (and other heavy ions).
In the Ondrejov spectra, we have Ca I 4226 yesterday suddenly making an entry. At the same time Ca II showed a higher velocity absorption than the H-beta line. So the ejecta seem to be showing some depth structure now.
What all this means is that we're watching a stage in a classical nova that hasn't been covered since photographic series on DQ Her, the last nova that was bright enough for such coverage in the modern era, although DN Gem and CP Pup were also well covered (but not like what all of you have produced!) As I've already written, we're in new territory here -- between observational capabilities and opportunities to catch individual events -- so it's important that you keep up your courage and bang away. It is possible that within the next week there it 'll be a shortlived absorption stage in CN 4216 (and also 3883). In the IR there should be a CO 2 micron emission stage. If the nova isn't a DQ Her type, then we really have no analog.
The continuing fluctuations in the photometry, also known from other novae at maximum light, remain a very deep problem and, again, any observations with the highest possible cadence (this also means longitude coverage from all of you to get the most continuous sequences) will be critical. For instance, the disappearance of the He I corresponded to a "local" peak in the optical light, this could be a recombination event or it could be multiple ejections. To speculate, so early, is too risky (even for a theorist!) so I'll stop now and hope this explains the stages you're seeing.
One more point, though. The recession of the absorption velocity is something also known from the DQ Her outburst, this is an effect of the change in the transparency of the ejecta. If this is the effect of seeing deeper into the layers at first during the late fireball, then it should reverse as he recombination sets in and the ejecta cool.
18-08-2013 The first decline
Detection of gamma rays
Thieery Lemoult - eShel - R = 11000
ATel#5302, Hays & al., 2013
The preliminary gamma-ray daily-averaged flux, F(E>100 MeV) = (3.3 +/- 0.8) x 10^-07 ph cm^-2 s^-1, and photon index, 2.2 +/- 0.2 (errors are statistical only), for August 18 are consistent with previous gamma-ray novae
H alpha H beta H gamma
Comments about gamma rays by Steve Shore Nova Del 2013 has been the in the energy range above 100 MeV. for perspective,
is is an energy interval where thermal processes are irrelevant and
indicate something relativistic is happening. More on that in a
moment.The detection makes this the second classical nova (third if
you count Nova Sco 2012 whose nature remains uncertain). The other was
V959 Mon = Nova Mon 2012, although the gamma-ray detection occurred
while the nova was invisible fro the ground due to the Sun. The first
detected nova, V407 Cyg = Nova Cyg 2010, was like RS Oph, a recurrent
(probably) nova that exploded within the wind of a red giant companion
so it was a physically very different mechanism that accelerated the
particles to the required energies although the avaklable energy was
ultimately the same.
The luminosity of Del 2013 is about 1/3 to 1/4 that of Mon 2012 at peak.
If novae are, somehow, a new sort of
"standard candle" in the gamma-ray range, then that implies a greater
distance (a factor of about 2 at most), placing Del 2013 at around 6-7
kpc. That is a problem since the nova is not in the plane and such a
distance is uncomfortably far above the height of the distribution
expected for the main population candidates. It also makes the nova
particularly luminous (and that is the next issue).
The gamma's are generated by a variety of processes, all involving accelerating either
electrons or protons to high enough energies that they either scatter
visible and UV into the MeV and higher range, or that the protons
collide and emit pions (remember those form the "nuclear glue", the
mesons that bind nuclei) that decay at around that energy (but not
higher). There's a hint that perhaps the energy range is more extended
and that would favor relativistic electrons scattering photons up to
higher energies (the inverse of the process, known from the birth of
modern physics, as Compton scattering; an electron scatters a photon at
low energy but releases it at high energy in the observer's frame of
reference).
Why this is important is that the origin of cosmic rays has been a
headache for almost a century (since shortly after they were
discovered). These are particles that must be actively accelerated,
likely by stellar sources such as supernovae, but the actual process is
elusive. If even little novae can do this, it makes it far more likely
that strong supernova shocks -- those expected when their ejecta slam
into the surrounding interstellar gas -- can work. That makes
astroparticle types salivate and for good reason, we have here
something that happens on human rather than Galactic timescales.
The other reason is the likely presence of internal shocks and
collisions between fragments of the ejecta. It's well known, and you
will all see this in the weeks ahead, that the ejecta are hardly
uniform or homogeneous, they consist of fragments of a wide range of
density and mass, and these will be clear once you start seeing
multiple absorption components on the main emission lines (e.g. Balmer
series, Na I, Ca II, Mg II, Fe II). But that's just barely staring and
the next couple of weeks will show what the structure of the ejecta is.
If these shocks are slamming into *each other*, the ejecta themselves
may be the site of the acceleration and therefore it becomes a generic
(!) phenomenon of novae depending only on the available energy and
mass. We don't know the answer to this and it's one of the reasons the
measurements of the slow peeling of the layers in which you're all
engaged is so important.
19-08-2013 The first decline - Smooth decline
Max + 3 days
Mag V ~ 5.0
Joan Guaro
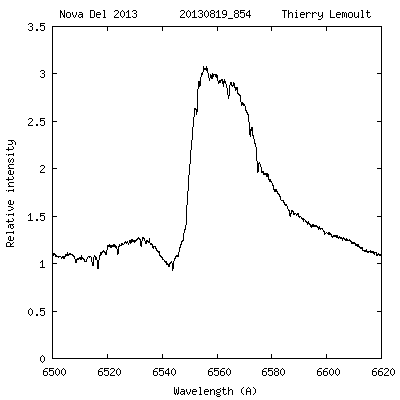
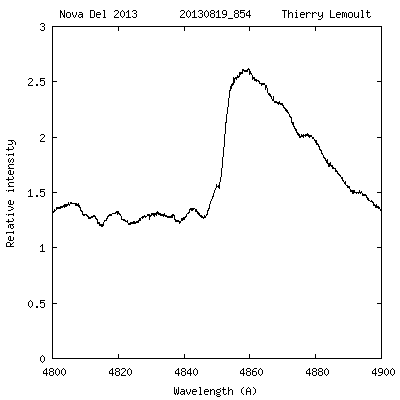
Thierry Lemoult- eShel - R = 11000
P cygni profiles vanishes
Balmer lines stengthens
H alpha H beta H gamma
22-08-2013 The first decline
Max + 6 days
Mag V ~ 5.8
Jean-Noël Terry Alpy600 R =650
C. Buil eShel R = 1000
H alpha H beta H gamma Focus on near UV/Blue and possible CN lines
Near UV - R. Leadbeater - LHIRES III 1200 l/mm Blue - C. Bui - eShel R = 11000
Comments about Dust formation and CN lines by Steve Shore Now a quick word for the moment about CN and why this is so important.
One paper (!!) by Wilson and Merrill http://adsabs.harvard.edu/abs/1935PASP...47...53W
reported this line and only in DQ Her. But they also discussed the Na I in another paper and Payne-Gaposchkin discussed this also. The molecule, CN, is amazingly stable for a radical (no, not a political comment). It has a high dissociation energy and can remain in stellar atmospheres to hotter values than the Sun (> 5800 K). The same for CH and CO but we don't see those in the optical; they've been detected in the IR. The usual molecule is CO that consumes almost all of the C w=o if that channel is saturated it means the C/O ratio is high enough for other organics and hydrocarbons to form. The others, often quite complex,
are seen in winds from highly evolved stars. And the higher the C abundance the more is available from which the solid phase -- dust -- can condense. Any isotopic anomalies remaining from the nuclear burning will also remain locked in teh dust so after a while drifting through the Galaxy (shades of the Hitchhiker's Guide, no?) they can be incorporated through passage in a molecular cloud, into a star.
The dust forms in a way we don't well understood but it is likely that molecular formation and growth is a signal of the right environment for the appearance of grains. This may be purely chemical, homogeneous condensation or "nucleation", or it may be induced (sorry, some of my own work) but whatever the mechanism, it happens. Therefore we can witness the dust formation process in a well constrained event and -- holy grail though it is -- figure out what triggers the dust formation. Other molecules have been detected in the IR, CO for example, but nothing from the cold matter in the ground state.In Nova del 2013, it seems that the CN has not appeared but it may yet and there's every reason to continue at all resolutions.

 DQ Her by Stratton and  Manning (1939)

with the CN 4216 band
Even at low resolution, many of you have caught the sight of narrow absorption features at high velocity, that look like P Cygni profiles, on the metallic lines and also on He I.
As I'd mentioned earlier, the explosion is initiated on the white dwarf
by the pile-up of garbage from the companion, like a bad landfill that
ignites. In fact, a silo explosion (a grain storage facility) isn't
very different; the matter is compressed and heated to the point where
a chemical reaction starts that is fueled by the combustible material.
The thermonuclear reactions, mainly involving CNO processed by protons
(hydrogen) from the accreted material, triggers a mixing process at the
interface between the accumulated layer and the envelope of the white
dwarf.
This is the part we can -- so far -- only model. The signature of the
process should remain in the explosion since the transformation from a
flame to a shock is very fast and unstable, leaving behind matter yet
unburned and throwing off the outermost layers at supersonic speeds.
Because the expansion is above the speed of sound, pressure is
irrelevant for the structures that might be imposed and they remain
preserved in the flow. In fact, you've seen something analogous to
this in everyday life. (the lovely thing about hydrodynamics is that
you can actually, physically, compare flows of very different kinds
when the processes are otherwise the same, a similarity notion). If
you've ever seen a waterfall or cascade this will be familiar. Until
the edge, the water is flowing slower than the speed of a gravity waver
(in other words, a water wave). But at the edge it falls and decouples
from any excitation, it's in freefall and the bits that start at a
higher speed arrive ahead of those that were nearer rest at the start.
But the sheet of water preserves all of the structure imposed at the
last point of contact before the edge, the filaments and knots you
follow downward that give a sense of the speed of the fall. That's
what we see in the ejecta and that's why these discrete features, those
now appearing, are tremendously important.
In the photographic era such lines were noted as "absorption systems"
that appeared at different stages of the light curve on the metallic
lines. These were difficult to track, often overlapping and highly
subjective since the spectra were often poorly calibrated or not at
all, and the zero levels were poorly defined. All of the observers
before the '70s clearly knew this but some were amazingly skilled at
recognizing the different absorption systems (and these were likely
real, the most careful could distinguish multiple components reliably
like McLaughlin -- who should be one of your heroes -- and
Payne-Gaposchkin). On the Fe-group lines, and the Balmer and neutral
helium lines, these also arise from the complex interconnections
between transitions I'd mentioned earlier for the optically thick
stage.
BUT the Na I lines -- the D feature -- is essentially
different. It's one of very few ground state (resonance) transitions
in the whole optical spectrum that isn't a forbidden transition
(intrinsically very weak). In fact, this is one of the strongest lines
in the spectrum and also neutral. The Ca II H and K doublet is another
but it's an ion. The K I line is in a terrible part of the spectrum,,
often (in many of your spectra, for instance, inevitably!) hidden under
a curtain of atmospheric water and molecular lines and hence unusable.
The Na I line is, instead, the unique tracer of the neutral medium and
the features that have now appeared on the D1,D2 components (together)
are at an intermediate velocity even with respect to the Fe II and
Balmer lines.In other novae, especially the work we've just finished
on T Pyx (an old friend of some of you) the velocities are intermediate
but the same as we see in the later stages, more than a year later the
same feature is still showing up in other ions. This means the
structures, the density enhancements in the ejecta, are actually not
moving with respect to the other gas in velocity and expansing as a
frozen-in feature, just like the waterfall. The striking thing is that
the velocities are intermediate, not the innermost of the ejecta and
far lower than the outermost (in other words, these are sort of
imbedded in the ejecta and "persistent"). Since the expansion is
supersonic, they don't "grow" spontaneously within the ejecta -- they
have to be imposed on the expelled matter at the time of ejection.
This points back to the explosion site itself, buried at the start
under the mass of the accreted layer. In T Pyx the broader narrow
features (what a description, no?) dissolve into an ensemble of
filaments of widths no more than 10's of km/s within a broader envelope
of a few hundred km/s but still far lower than the several thousand
km/s of the expansion.
That these are seen in a certain stage is the result, it seems, of a
recombination wave I'd discussed earlier. But the most important
feature is that being resonance lines from a neutral species, these
features trace the progress of the recombination better than any
metallic or Balmer lines. Now, in the last spectra sent by Christian
Buil, you see the two Na I feature but, if you displace to the first
spectrum and use He I 876 (that then disappeared after Aug. 15) you'll
see that He I also now has a detached feature. These absorb at a
specific position (radial position) in the ejecta and they have to be
large or we wouldn't see the absorption. In V705 Cas 1994 they formed
as soon as the Nea I emission peak strengthened. The same in T Pyx.
For V959 Mon we don't know because it was hidden, and few other novae
have been caught at high time coverage (and also higher resolution, R >
1000) to make the evolution clear. And taking the Ca II to Na I ratio
at each component is a direct measure of the ionization fraction (not
just abundance since the Ca/Na elemental ratio doesn't change while Ca
II/Na I will. As the wave progressed you will see different features
appear on different lines but always within the same intervals.
Comparison between an amateur (Buil)
and a professionnal spectrum (Ondrejov Observatory)Comments from Steve Shore :
" This is just one order, it's VERY good agreement and this time -- pure chance -- the spectra are literally simultaneous. This should clear any doubts about the quality of the spectra produced by ARAS "
Most of the spectra of the ARAS Data Base have been treated with ISIS software (C. Buil) ISIS Page
Publication in ATel#5312, Shore & al., 2013 Continuing spectroscopic observations (3500-8800A) of Nova Del 2013 with the Ondrejov Observatory and the ARAS group
ATel #5312; S. N. Shore (Univ. of Pisa, INFN-Pisa); P. Skoda, D. Korcakova, P. Koubsky R. K?Ã?ek, P. Rutsch, M. Slechta ((Astronomical Institute, Academy of Sciences of the Czech Republic- Ondrejov, Czech Republic); O. Garde, O. Thizy , T. de France, D. Antao, J. Edlin, K. Graham, J. Guarro, F. Teyssier, P. Berard, i T. Bohlsen, E. Pollmann, T. Lemoult, A. Favaro, J.-N. Terry, E. Barbotin, F. Boubault, J. P. Masviel, R. Leadbeater, C. Buil, B. Mauclaire (contributing participants, ARAS)
on 23 Aug 2013; 01:15 UT
Distributed as an Instant Email Notice Novae
Credential Certification: S. N. Shore (shore@df.unipi.it)Subjects: Optical, Cataclysmic Variable, Nova
Observations with the Ondrejov Observatory 2m Zeiss coude spectrograph (R = 18000) are continuing covering the range 3550 - 8870 A (see ATel #5282). High cadence spectroscopic monitoring by the Astronomical Ring for Access to Spectroscopy (ARAS) began on 2013 Apr. 14.8 and has continued uninterrupted covering the wavelength interval at resolutions ranging from 3684 - 7431 A with resolutions ranging from 580 - 11000 with time sequences as short as 10 minutes at resolutions up to 12000. The ARAS spectra(at this writing more than 230) are publicly available at the consortium website: http://www.astrosurf.com/aras/Aras_DataBase/Novae/Nova-Del-2013.htmParticipating observers are throughout Europe, North America, and Australia. The coverage is especially dense during the period spanned by the Fermi/LAt detection and continuing observations. The rapid changes reported by the Liverpool group (ATel#5300) have not only been confirmed but resolved although the shortest interval in which significant line profile changes were detected (R > 700) was > 6 hrs with the variations being far less prominent on Aug. 20. In addition to reports in Atel #5304, ATel #5305, Balmer absorption components were detected to at least H14 on Aug. 22 (HJD 2456522.6) with vrad (abs. min) = -600+/-50 km/s. As reported, the absorption on the lower Balmer lines is also at this low velocity but the emission wings extend now to approximately +/-2000 km/s, consistent with the maximum velocity reported in the first observations from Aug. 14. The Na I D line now shows a complex absorption trough, possibly with components of both the D1 and D2 lines at -850 and -600 km/s. On Aug. 22.8 the Fe II 4921,5018 A showed absorption extending to -1400 km/s with weak indications of incipient narrow absorption at lower velocities. In the 8400-800 A region, O I 8446 may show absorption but has a profile compatible with the Na I emission and no discernible mean redshift. The changes are now relatively slower than during the first week and the nova is likely deep into the Fe-curtain phase in the UV having now passed out of the fireball. The line profiles suggest possible asphericity of the ejecta but it would be premature to speculate further. Multiwavelength spectroscopy, especially in the infrared between 2.1 =- 2.3 microns (for Na I 2.20 micron, CO 2.15 microns, etc) are extremely important now; the only feature clearly present at CN 3883, 4216 are atomic lines (e.g. Ca I 4226) but this is the period during which any molecular formation would be observed; regardless of the rate of optical decline this stage is critical to cover with R > 500 and over broad spectral range.
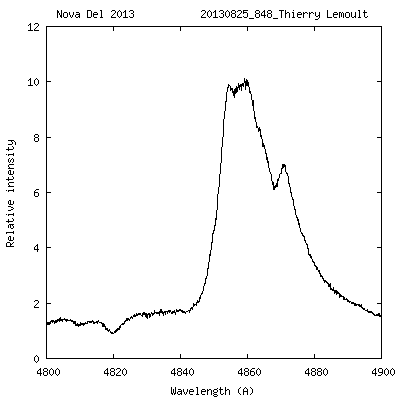
25-08-2013
Max + 9 days
Mag V ~ 6.3 ( ~ Mag V max + 2)
J. Edlin Lisa R =1000
T. Lemoult eShel R = 1000
H alpha H beta H gamma
Next Page - The first decline 1st part
Miscellanous treatments by ARAS observers
Ha evolution E. Barbotin

Ha evolution O. Garde

Ha evolution Ernst Pollmann

Spectral evolution (gif) by Paolo Berardi Link A MUST !
Spectral evolution by Olivier Thizy : a continuous coverage during 10 nights
Page built by François Teyssier - 25-08-2013 |
|---|