NOVA Del 2013 = V339 Del
An amateur spectroscopic survey of a bright classical CO Nova
|
|
NOVA Del 2013 = V339 Del An amateur spectroscopic survey of a bright classical CO Nova |
||||||
|---|---|---|---|---|---|---|---|
| - 3 - |
|
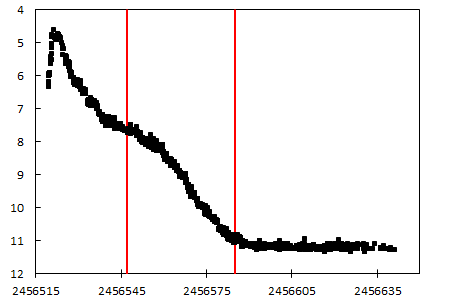
The first decline - Second part
12 september to 20 october 2013
Mag V 7.8 to Mag V 10.8From N flash to the nebular phase : after a short the luminosity curve declines from mag 8 to mag 11. High ionization lines such [OIII] and He II appear during this period
The continuum remains almost unchanged
The Balmer profiles evolves
The forbidden and high ionisation lines increase
([OIII], NIII, He II,[N II] ...)
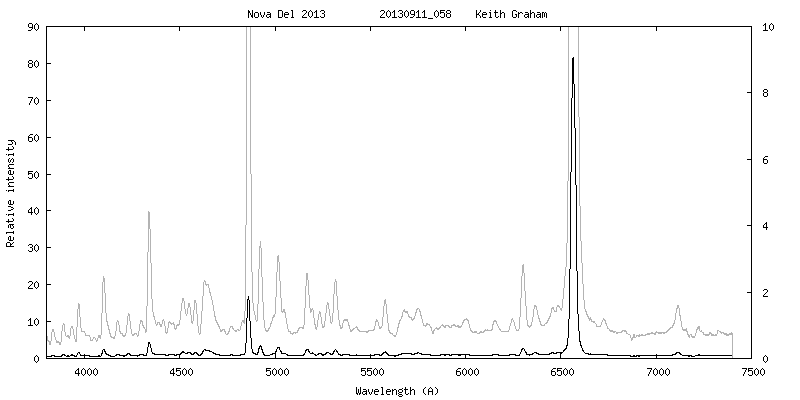
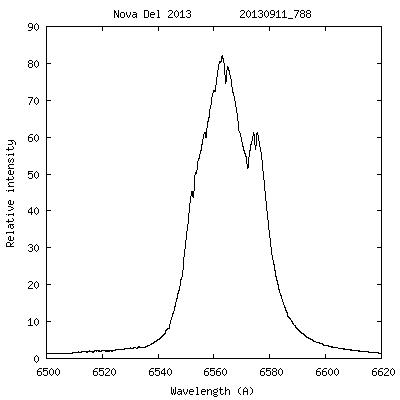
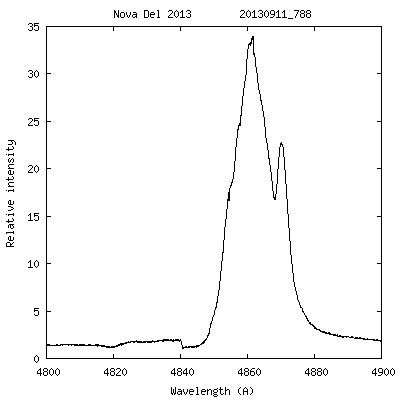
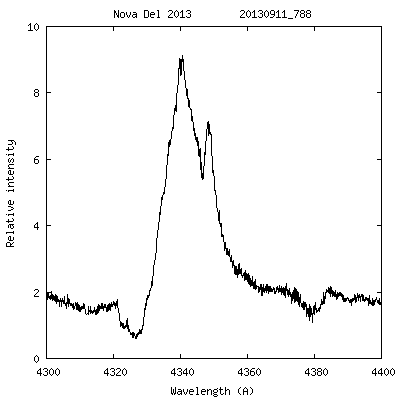
11-09-2013
Max + 26 days
Mag V ~ 7.6 ( ~ Mag V max + 3.3)
K. Graham Lisa R =1000
C. Buil eShel R = 11000
H alpha H beta H gamma
Fe spectrum by Steve Shore 11 09-2013
elements because the Balmer lines are so weak. Payne (later
Payne-Gaposchkin, yes, her!) demonstrated that requiring ionization
equilibrium as a function of density and temperature together with
hydrostatic and thermal balance produces a spectrum that changes
appearance even with constant abundance. Novae are strange because
they pass through so many regimes of temperature and density that,
unlike a star, vary on short timescale (hence nova ejecta NEVER
resemble a stellar atmosphere and rarely a wind). The Fe isn't a
product of any nucleosynthesis during the nova, any more than it is in
a red giant compared to a main sequence hot star. It's an effect of
the ionization and line formation. The lines are relatively more
intense because they arise from a dominant ion. For instance, were the
temperature as high as during the fireball, you'd see only He I and
Balmer lines, it's the same ejecta you were observing a month ago but
the temperature and density conditions are very different now.For the temperatures reached in the thermonuclear runaway, less than
0.3-0.5 GK (a few 100 keV), you don't obtain free neutrons (for the
heaviest elements, as in r-process), you don't have enough time for
s-process, and the explosion isn't the result of gravitational collapse
so the energies available are far lower and you have reactions of
charged particles that run similarly to a stellar interior. To get to
iron and the heaviest elements requires continued special conditions
that break out of the A < 40 region (e.g. calcium), and that doesn't
occur "Fe II novae"This term "Fe II" nova is, again, just a way of saying "still optically
thick and cool". The temperature of the ejecta drops from expansion,
recombination leads to a more neutral medium, and the radiation field
is shifted to the UV and absorbed there to be re-emitted in the
visible. At the same time the excitation by collisions becomes less
efficient for the higher states, it's linked to the kinetic (actual
thermal motion) temperature of the ambient electrons, and the lower
temperature also means recombinations are more effective in reducing
the ionization. So the combination leaves the metal lines, which are
present in two ionization stages (at least) and come from about a dozen
possible species with literally millions of possible exciting coupled
transitions, dominate the spectrum. The same sort of state change
happens in a supernova expansion but at a different rate and is more
complicated because of the radioactive material from the
nucleosynthesis and the stronger shock (not to mention more matter).
The abundances of the heaviest elements, e.g. Fe and higher, are so
high because of internal nucleosynthesis in the fireball of the
expanding envelope of the collapsed star.Again, it's important to emphasize that the processes we see for line
formation in a nova are like those in a star but in a dynamic medium so
the complications result from the interplay of velocity differences and
total abundances. The heavy elements, even at 10^-5 the abundance
of H and He, are still the main contributors to the opacity in any cosmic
plasma with solar abundances or the like in the temperature range below
about 100 kK.
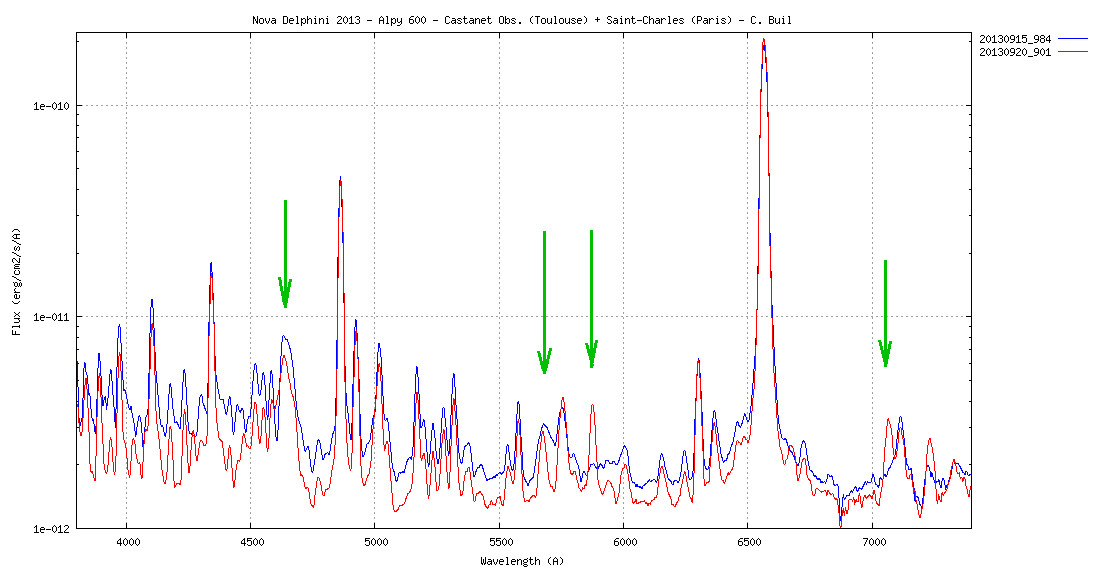
Universality of the optically thin profilesThe universality of the optically thin profiles, the best examples being the O I lines,
makes for a useful tool -- the peak at +550 km/s is identical in all
the profiles and just this one peak is enough to link to the rest
wavelength. I've checked this with about a dozen examples and it works
almost perfectly, meaning that the ionization and density structures
are being identically sampled by all available lines (mainly neutrals).One example: next to Fe II 5018 there's an emission that *could* be He
II 5047. But using the profile, it is almost certainly C I, like the
7115 A line. The one for which it isn't working is the line aroun 6720A.
That's still a sort of mystery and since it's even visible at
low resolution (< 3000) I recommend keeping track of its development in
the next few weeks. It could be something interesting.
by Steve Shore 14/16 09-2013
important. There are few N I lines of interest in the optical spectrum
and these are all tied to absorption < 980A and mechanisms like those
for O I of fluorescence with the Lyman transitions. Monitoring these
specific lines is usefull, whether in novae or other evolving
environments, for getting a handle on the UV opacities. Notice that the
Balmer wings are still very broad, at a very low level but out to
almost 1800 km/s. Really lovely! The stability of the light curve and
the line profile is quite pretty and the variations of specific
transitions, like "6726". will give you an idea of how the physical
conditions are changing.Actually, this highlights a point I hadn't mentioned before. You see
that if you catch one of these beasts at any moment the spectrum may
seem quite stable, like Del is now, but if you get it at a very early
stage it can look very different. That highlights the difference I was
mentioning some time back between atmospheres and dynamical media, in a star the atmospheric structure is fixed so changes in the spectrum,
which do happen, are always either periodic or subtle. If something
happens that's out of mechanical balance the spectrum, reflecting the
changes in the local and global environment (e.g. density, pressure)
changes on a wide range of timescales (collisional/recombination;
radiative/ionization, all of which are different than the dynamical --
expansion/collapse -- timescales )The weakness of the emission is an indication of ionization, I think. The Balmer lines have the largest contrast, then O I, then C I (unfortunately there are few lines in the IR well resolved to check that for the lower states of carbon). There's also an N I 6722.66 line that could be the identification, but yours makes very good sense since it's linked to the 8446 pumped states. The line is a doublet with the mean being 67. The transition probability is very low, it's an intercombination line that's increased in flux by about a factor of 50% between 28/8 and 8/9 from the NOT spectra (the plot has the continuum scaled by 1/1.5 for the earlier spectrum, dots are 28/8/13). The one peculiarity is the symmetry of the emission, even with a doublet (the separation is only a few km/s).
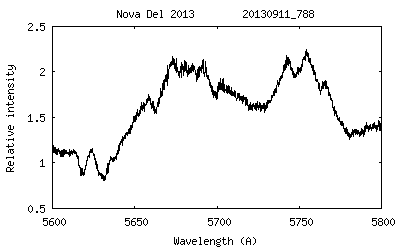
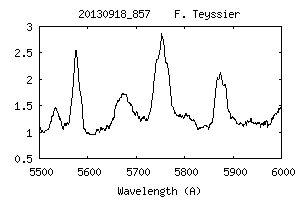
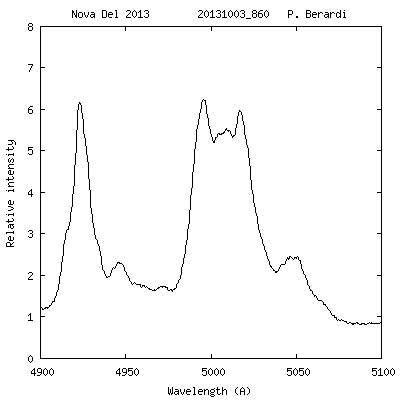
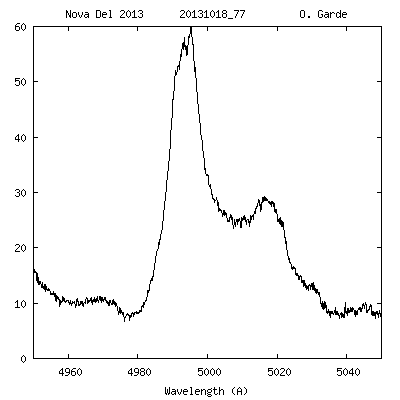
... there's now a clear detection of [N II] 5755A
NII 5679 and [NII] 5755 lines in C. Buil spectrum (11-09-2013)
Two regions are especially important aside from those you've been generally covering:
4500-5100 (for the C,N lines, He I, and He II and Fe II) and the red, 7200 - 8000 A.
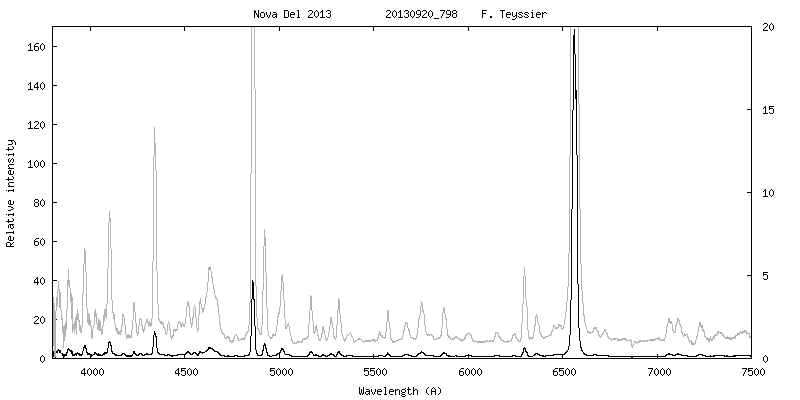
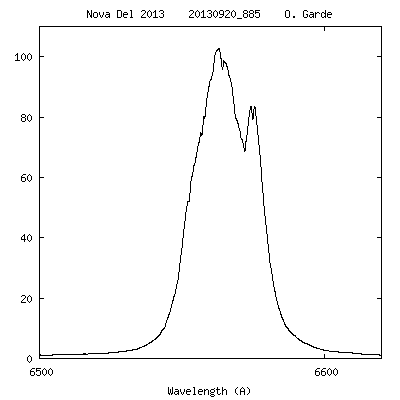
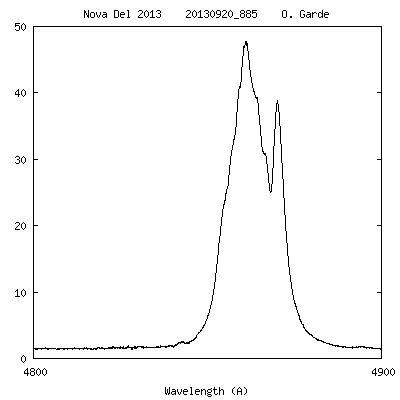
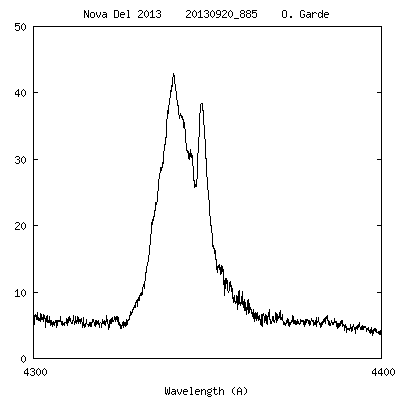
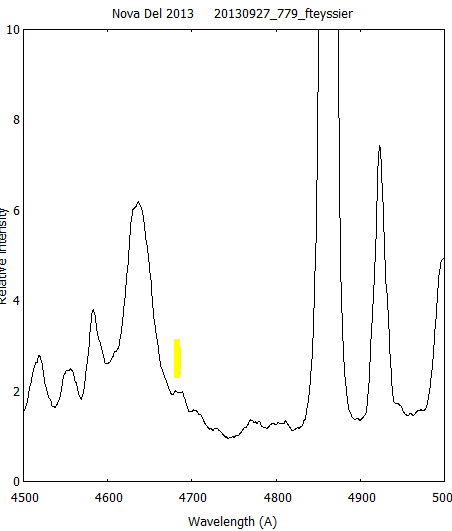
20-09-2013
Max + 35 days
Mag V ~ 8.1 ( ~ Mag V max + 3.8)
F. Teyssier Lisa R =1000
O. Garde eShel R = 11000
Helium Flash
H alpha H beta H gamma
Evolution of the spectrum by Steve Shore 18-09-2013
the Halpha wing), and 7065 so the ionization is progressing in the
ejecta. The [N II] 5755 line seems to have been present as early as
Sep. 8 but it's now not only quite strong but also shows the same
profile as the other optically thin lines. The He I, in contrast,
shows a strong emission but also possibly (at low resolution) an
absorption at moderate velocity. The N III complex around 4640 has
remained essentially unchanged, an indication that the UV is still
marginally thick, but if it's not too much of a stretch it looks like
He II 4686 may be present.If you look now at the spectra you'll see one of the effects I was
discussing earlier, something that shows up contrasting the Balmer and
He I lines. The [N II] and [O I] aren't only forbidden, they're also
ground state transitions. The others are from excited states which
means their populations are determined by recombination and photons in
the UV that populate these levels. For example, something I should
have mentioned earlier, the Lyman series is responsible for the
occupation of the Balmer line levels, Ly alpha couples to the n=2 state
of hydrogen but Ly beta, because its upper state is n=3 -- if optically
thick -- powers some (or most) of the emission on H alpha (n=3 -> n=2).Now, again, think like a photon. If the ejecta are not spherical,
these photons can leak out both through the main Balmer lines and also
from the sort of surface that isn't a sphere. You see that in the
highest velocity parts of the Balmer line profiles that are stronger
than anything (by contrast) on the other lines that are intrinsically
weaker (and also from much less abundant species). So the peaks have
the same velocities but the relative contrast in densities between
different parts of the ejecta you see more clearly in the Balmer lines
than the others. The He I (and eventually He II) form in the inner
ejecta so they have less visible "horns" since the line is weak from
the outer ejecta.These last spectra, at R ~ 1000, show the value of continuing the lower
resolution work. Don't get frustrated that the details may not be as
evident. If you have a resolution of ~ 100 km/s that's a good coverage
of lines that spread over a few thousand km/s, remember that much of
the UV work was based on IUE spectra with the same (or lower)
resolution! For example, it looks now like the absorption on H delta
is displaced from the line at about -2000 km/s, as it has been in other
novae at this stage. But this is so far the only line that seems to
show this (it can't be a blend with [S II]4076 since that's a doublet
and has a high ionization energy, it's something seen in shocks of high
velocity around protostellar jets, for instance, and in supernova
remnants along with [S II]6713, 6730) but here the absorption seem real.A few other diagnostics are important, in part because they're not yet
seen. Neither [Fe VII] 6086 nor [Fe X] 6376 are present, so if there
is any XR emissionn irradiating the ejecta it is still being absorbed
by so much cooler mater in the inner part that it can't yet ionize the
regions of lower density in the periphery. The [O III] 4363, 4959,
5007 lines are not there yet, again a strong pointer to the still high
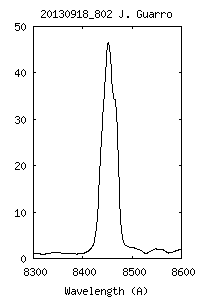
opacity in the middle and far UV. Yet the O I 8446 remains strong, so
there is a very strong pumping still by Ly alpha of the O I 1302
resonance line.I hope the emphasis on small things won't mean you're staring to lose
the big picture. The reason for all these details is to give you an
idea of how to diagnose this particularly ill patient. Like a
prescription in Hippocrates or Galen, you look at all the symptoms
before making a diagnosis. Look at which lines are visible noting the
ionization state. At this stage it will be more important than which
lines in a specific ion are there. Look at how the line profiles
change with that ionization energy, this is the tomography of the body.
He I 4923, 5876, 6678 (weak, onthe Halpha wing) , and 7065
so the ionization is progressing in theejectaThe [N II] 5755 line seems to have been present as early as
Sep. 8 but it's now not only quite strong
the O I 8446 remains strong,
so there is a very strong pumping
still by Ly alpha of the O I 1302 resonance line.
Dust formation episode ? by Steve Shore 25-09-2013
optical photometry that V338 Del may be entering a dust formation
episode. If this is really happening there are several important
things to note for observations in this next week. Note that this will
be the first time since DQ Her, if really starting, that this stage
will have been seen and it was impossible to follow that nova (in 1934)
during the minimum. You all have the low resolution capability to keep
going -- if you want to -- even through much of what could be a deep
minimum (a drop of 5 or more magnitudes is not impossible). For high
resolution observations, a question is where and how the dust forms.We know something of this from the very old observation of V705 Cas
1993 that was observed in the UV during the start of the episode
(http://adsabs.harvard.edu/abs/1994Natur.369..539S) but that was a
chance observation not covered in the optical.
First, assuming the ejecta are bipolar and inclined,
the line profiles may change in a peculiar way: as the dust formation
proceeds the portion of the ejecta (the outer part) should become
opaque (depending on the geometry) and the blue part of the line will
disappear. On the other hand, the whole profile will drop, especially
for the N II line and He I lines, if the ejecta are more spherical
because both parts of the line forming region will be absorbed.
The UV has now been measured, we know how much energy is available for
absorption by the grains and that emission in the infrared can be
compared with that lost in the visible. If the two balance out
(everything absorbed is re-emitted) we'll know that the ejecta are
spherical (every photon wis intercepted in a spherical, completely
opaque shell). On the other hand, if there is an imbalance, that will
be due to the filling factor and geometry of the ejecta. So if this
really is the start of the event, the ejecta will act as a sort of
calorimeter, registering how the energy balance proceeds.
The changes in different lines (e.g. [O I] vs. He I) indicate where in
the ejecta the dust is forming, although at this stage I have to say we
don't know much -- only V705 Cas has been observed during such an event
and in the UV at low resolution. When it happened there, the whole UV
disappeared without the spectrum changing, as if a new "curtain"
dropped uniformly over the line forming region. This time, it's
anyone's guess and your work will be vital.One more thing: none of the spectra showed ANY indication of molecular
emission (CO, in the IR) or CN (in the optical, your hard work).
If this nova forms dust, we will have learned something tremendous, that
molecular formation is not a precursor event to dust condensation.
If so, it is in line with the idea that reactions between neutral atoms
and ions of carbon and silicon cause a sort of kinetic runaway in which
the grains aggregate like fluffballs. No matter what now happens,
without your spectra we would not know that this nova did not form the
molecular seeds and that if this does condense it likely is
particle-based process instead of a thermodynamic-like phase transition
(the difference between agglomeration (kinetic) and homogeneous
nucleation (like terrestrial clouds and rain, around nuclei in a
saturated vapor) (qrwith apologies for referring to my own stuff butthis paper is an example of what I'm talking about:
http://adsabs.harvard.edu/abs/2004A%26A...417..695S ; see also
http://adsabs.harvard.edu/abs/2012BASI...40..213E)
http://adsabs.harvard.edu/abs/2007M%26PS...42.1135J
Only time will now tell but I hope you're getting some idea from this
how important your observations have been and are.
The important thing to note is that such events have been observed in
supernova ejecta in early stages but, again, that is complicated by the
very complicated ejecta structure.  Here it is simpler and since we
have the optical and UV just before this event the luminosity of the
white dwarf and the continuum of the ejecta is known.
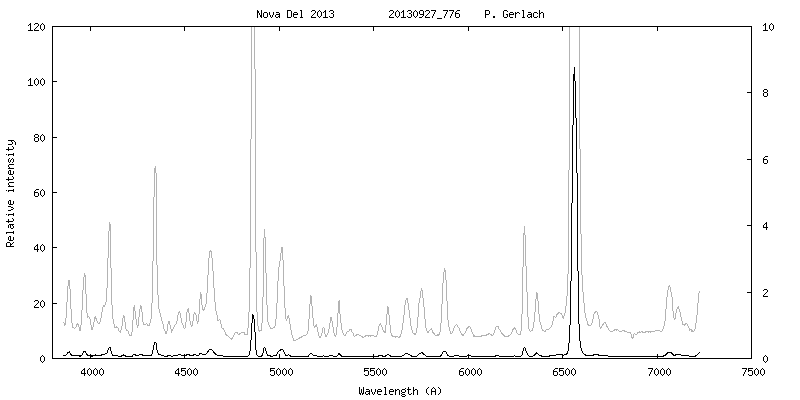
27-09-2013
Max + 42 days
Mag V ~ 8.8 ( ~ Mag V max + 4.4)
P. Gerlach DADOS R =900
First apparence of He II and [OIII] 5007
Detection of X rays by Swift ATel #5429
V339 Del (Nova Del 2013) is a weak non-super-soft X-ray source
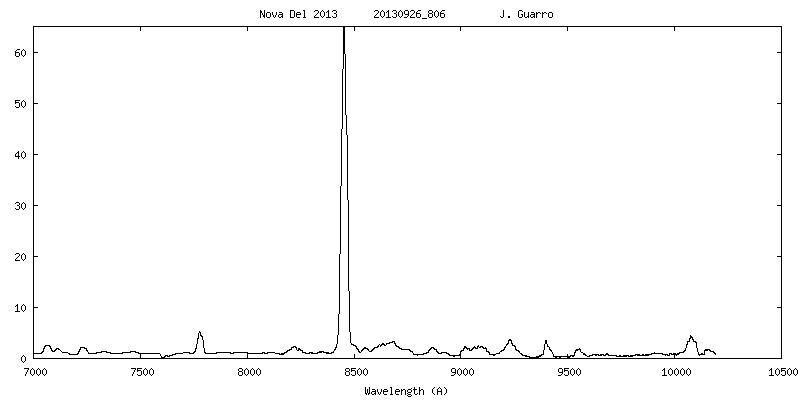
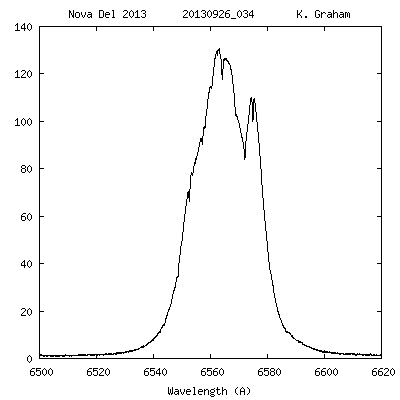
Near IR (Joan Guarro) H alpha (Keith Graham)
X-rays detection and strengthening ionization by Steve Shore
The Swift team has just announced the detection of X-ray emission from
V339 Del (ATel #5429). They give a flux that is a very small fraction
of the STIS detection: in the range from 1-10 keV (corresponding to a
temperature of about 10 MK), 2.3e-13 erg/s/cm^2 while the UV
(1200-3000A) gives 1.7e-8 erg/s/cm^2. This large ratio is at the start
of the event but has already been corrected for hydrogen absorption.
Interestingly, the Lyman alpha line in the UV observations seems
weaker than would be expected from the XR data, a suggestion that the
ejecta are also not completely covering the central start but are
covering the region of XR emission. The nova remains very bright in
the visible and this is a real problem for the XRT on Swift that
suffers from optical leaks (it's the nature of the detector). Your
spectra are indicating the start of [O III] 4959,5007 emission and
also that He II 4686 is there. Now the He II 5411 line should also
appear (a check on the He II identification) and the disappearance of
the Fe II and other curtain lines will be a very important (and pretty)
thing to watch over the next one to two weeks.To put this part in physical context, what's happening is an advance,
from the inside out, of the ionization front as the WD emission
strengthens. It's always the same basic picture, but the phenomenology
accelerates now. The ionization of the heavy metal lines removes the
opacity faster than the change in density so the optical decline should
also steepen (which may be mistaken for a dust-forming event), and the
highest ionization lines from permitted transitions will have narrower
profiles and come from the inner ejecta. The outer part, and here the
ionization state is a very good measure of the filling factor (how
fragmented the ejecta are governs how much of the ionizing radiation
penetrates to the outer part at this marginally thick stage); their
profiles (highest ionization lines)at high resolution will be the best comparison with the [O I] and [N II] as a map of the ejecta structure. Remember, He II is from
excited states but are all permitted transitions while the [O III] and
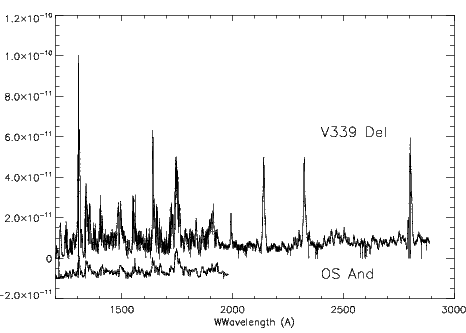
others are low density transitions (forbidden).To give some idea of what things look like in the UV I'm including the
OS And - V339 Del comparison. The very narrow lines that go to zero in
the V339 spectrum are all interstellar transitions (keep in mind that
the resolution is about 100,000). For OS And, it is about 10000 (high
resolution IUE from Dec. 1986). No extinction correction has been
applied (no interstellar dust effects have been removed) for the
comparison) so you can see the lines (e.g. He II 1640 + curtain, N III
1750, Mg II 2800, etc). The 1200A region is particularly important for
the properties of the ISM and the ejecta -- this is where the Ly-alpha
profile sits (you see there seems to be emission there, and in fact
there is a P Cyg profile under the curtain on the line).
Detection of He II (LISA R = 1050)
Your spectra are indicating the start of [O III] 4959,5007 emission and
also that He II 4686 is there. Now the He II 5411 line should also
appearComparison between V339 Del and OS And in UV
... you can see the lines (e.g. He II 1640 + curtain, N III
1750, Mg II 2800, etc). The 1200A region is particularly important for
the properties of the ISM and the ejecta -- this is where the Ly-alpha
profile sits (you see there seems to be emission there, and in fact
there is a P Cyg profile under the curtain on the line)
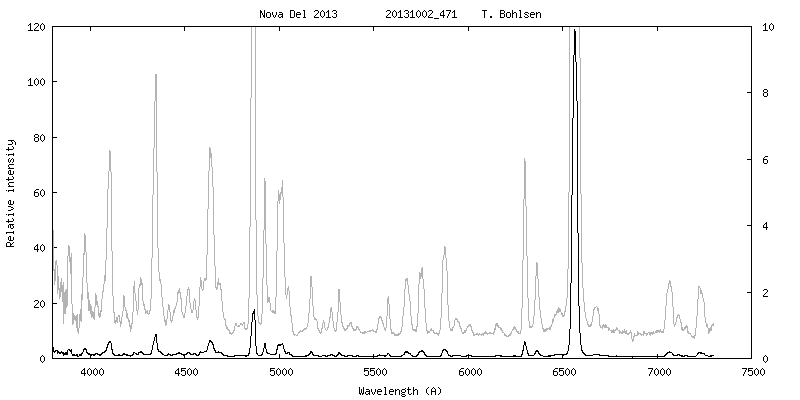
02-10-2013
Max + 47 days
Mag V ~ 9.3 ( ~ Mag V max + 5.0)
P. Gerlach DADOS R =900
T. Lemoult eShel R = 11000
H alpha H beta H gamma
02-10-2013 About luminosity curve and dust formation
Our friend continues a steady decline, with some bumps, despite the
recent flurry of reports of dust formation. First, let me explain what
the observations may be saying and then, to illustrate what you're
seeing tin the data, add a few points about the ejecta structure.Dust, being the solid state, behaves like bricks. Radiation is
absorbed with an efficiency depending on the grain composition and
re-emitted locally with whatever temperature the grain has to reach to
balance the rate of absorption. This is referred to as "radiative
equilibrium": if the temperature reaches a steady state while the
irradiation is steady, it will get as hot as it "needs to be". The
incident photons are energetic, optical and UV. But they are diluted
by distance from the emitter. So the energy density is lower than near
the central WD or even the inner ejecta. Thus the rate of absorption
is lower with increasing distance. A solid doesn't behave like a
blackbody in its spectrum, but the emission rate depends only on
temperature so the farther the grain is from the central source the
lower its temperature will be in equilibrium. This is almost
independent of the size of the grain so it could be a peanut or a
planet, the energy per unit area (flux) is all that has to balance (the
book-keeping is: what comes in, goes out). Some critical temperature
must be crossed for the solid to be stable, otherwise it will evaporate
by heating (loss of atoms), that is the so-called "Debye temperature"
below which the solid ()or atomic cluster) remains structurally intact.
This, for silicates and various forms of carbon (usually called
"astronomical graphite" because of laboratory analogies) is about 1500
K. It means, in a kinetic (particle) sense that collisions with this
relative velocity (the sound -- or gas -- speed corresponding to this
temperature is about 1 km/s) can bind (stick) and nuclear clusters
remain stable. As the cross section increases the quantity of energy
absorbed increases so while the temperature doesn't change the
luminosity does. Since the grains reach a low temperature, they
radiate in the infrared and that's the tell-tale signature of their
presence. It isn't only a drop in the light of the ejecta photosphere
and WD. That depends on viewing angle, how you see through this
growing smog. But the infrared is transparent so you see the
cumulative radiation from the grains as an increase in the part of the
spectrum where a solid would radiate. The controversy now is whether L
and M band photometry (longward of a few microns) has increased
sufficiently to signal the presence of this absorber. Two groups seem
to agree on this now but as a recent event, around Sept. 29 but thsi
requires further data. If we're in that stage, it's just preliminary
and recall that neither CN nor CO were detected in the nova when the Na
I lines were strong.The cross section, if dominated by direct absorption, also has certain
characteristics. Silicates (SiO complexes) are rather opaque at 10 and
12 microns (there's a peak in the broadband emissivity there) and
rather inefficient absorbers in the UV. In contrast, the carbon
complexes are very good absorbers at around 0.20 - 0.22 microns
(2000-2200A) in the uv so they absorb where the irradiation is maximal
and radiate less efficiently in the IR because they lack the bands of
the silicates. Thus, graphite (carbon) grains will be systematically
higher temperature in equilibrium than silicates. It's likely that the
grains will be carbonaceous so they'll be hotter than silicate grains
(that are inefficient absorbers, efficient radiators in the peak
emitting range).This all relates to where the dust will form. To date, the NOT
profiles are the same as they were, no obscuration by the grains. This
may change we'll have to wait a bit. The main interest now will be the
process itself, if grans are there. But there's another, albeit
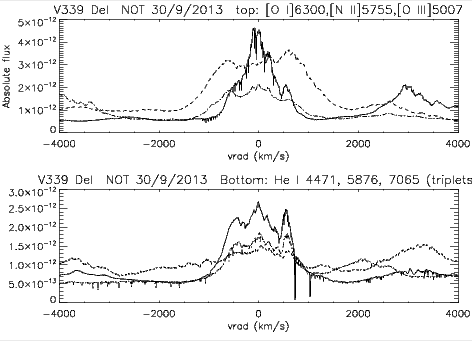
slower, physical effect that we can now see.Lines profiles
Since the ejecta are ionizing now, the profiles of different ions will
trace out different parts of the ejecta at the same time. In the
enclosed figure, you see this. The top is neutral oxygen, ionized
nitrogen, and twice ionized oxygen (the 5007 is a doublet with 4959,
that is just barely present) and has the greatest velocity width and a
unique profiles that resembles what was seen at the start on the Balmer
lines. Yes, the [O III] lines do seem to be there. Since these are
forbidden transitions, they trace low density ionized gas and the wings
suggest these are in the outer portions of the ejecta. The [N II] is
intermediate. And now the He I line profiles share the Balmer line
structure, these require a very a high excitation energy so suggest
that recombination formed these. The C II 8335 line is also now
present, but there's nothing yet at the [Fe VII] or [Fe X} optical
lines.There's a flight scheduled for SOFIA and we'll keep monitoring the
spectrum. Please don't give up now, remember that if we're ever going
to understand such a simple thing as a nova, a lot of hard work will be
preceding. The XR/Swift data to date requires about a factor of 10
higher column density than derived from the UV Lyman alpha line, have
in the whole ISM toward the nova.The XR turn-on was fast as far as can be known from the descriptions.
... the profiles of different ions will
trace out different parts of the ejecta at the same time
... the [O III] lines do seem to be there
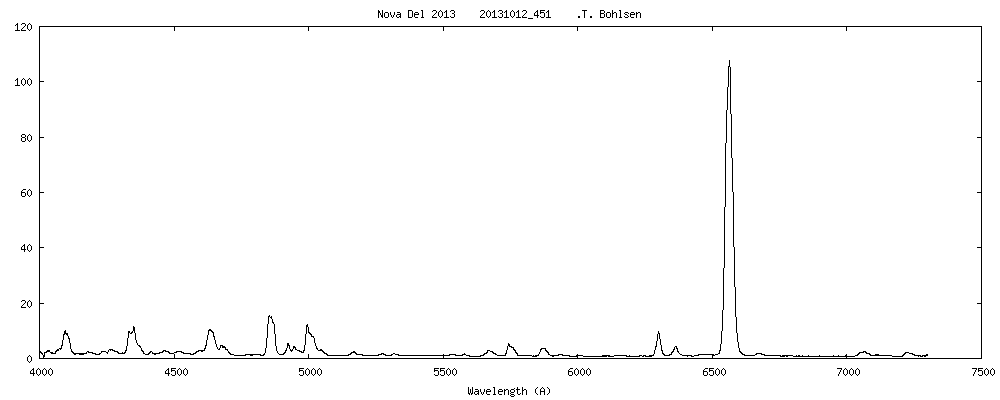
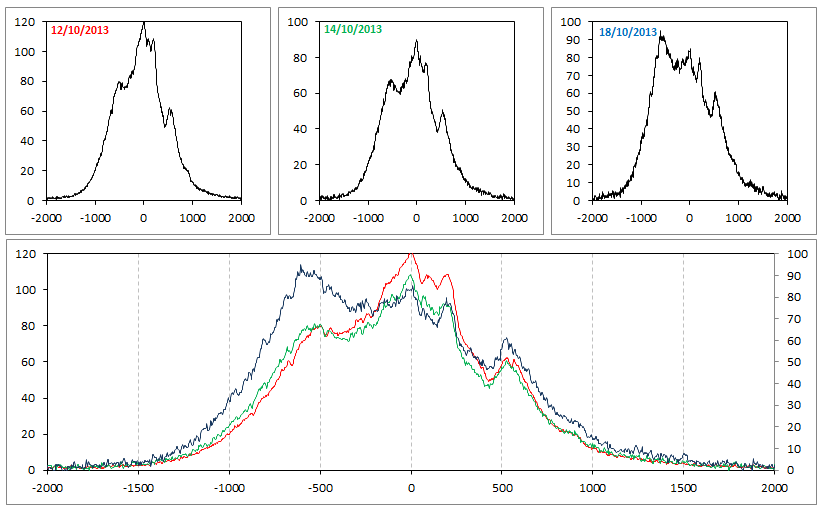
12-10-2013
Max + 65 days
Mag V ~ 11.0 ( ~ Mag V max + 6.7)
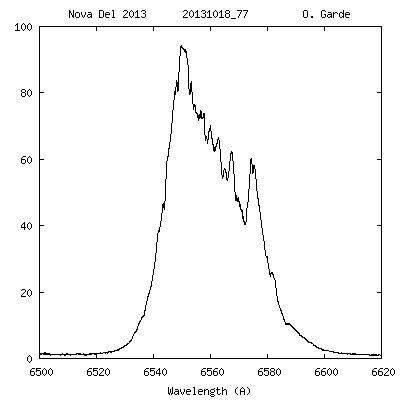
Rapid change in H alpha profile
Changes in H alpha profile Keith Graham spectra at R = 12000
x axis = velocity in km/s relative to rest wavelenght (6562.8 A)
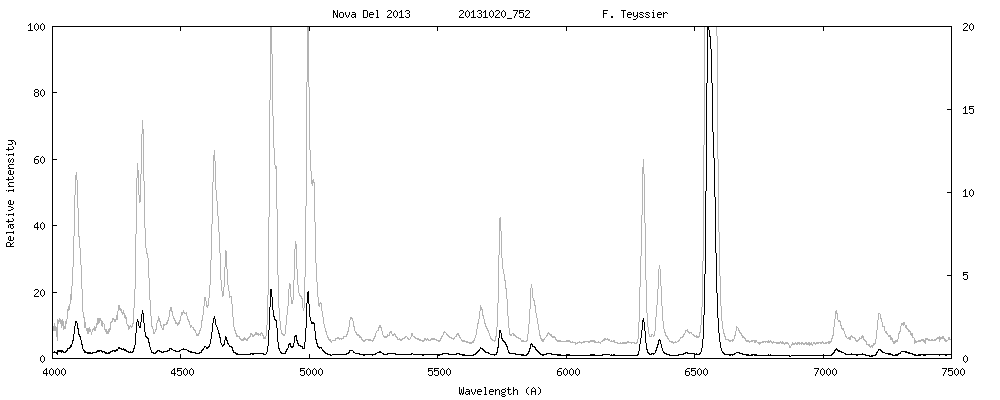
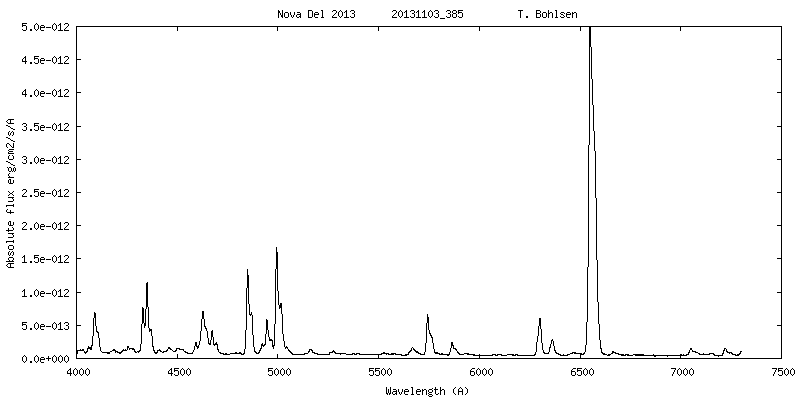
20-10-2013
Max + 65 days
Mag V ~ 11.0 ( ~ Mag V max + 6.7)
O. Garde eShel R = 11000
Begining of the plateau
Nebular phase
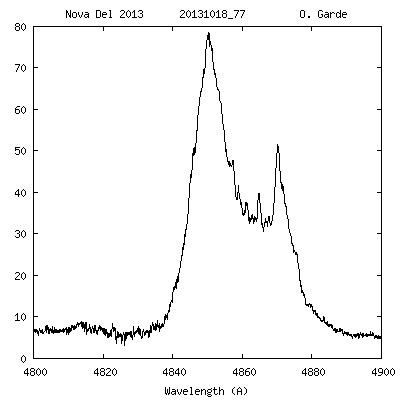
H alpha H beta [O III]
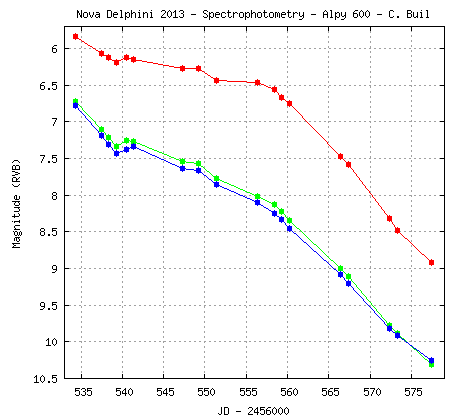
Spectrophotometry
During this campaign, absolute flux calibration have been developped by amateur community, with two methods :
1. Photometric standart (Christian Buil)
http://www.astrosurf.com/buil/nova_del2013/photometry.htm
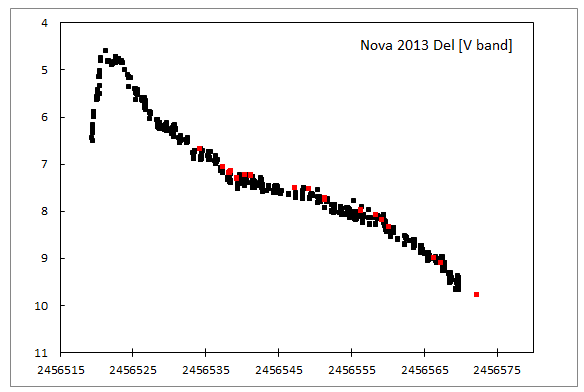
B V R light curve - Spectrophotometric method Christian Buil Comparison of Christian Buil's V magnitude (red squares) with AAVSO (filtered) data 2. Using V magnitude ( Martin Dubs)
| Page built by François Teyssier - 26-12-2013 |
|---|