NOVA Del 2013 = V339 Del
An amateur spectroscopic survey of a bright classical CO Nova
|
|
NOVA Del 2013 = V339 Del An amateur spectroscopic survey of a bright classical CO Nova |
||||||
|---|---|---|---|---|---|---|---|
| - 4 - |
|
The nebular phase
21-10-2013 to 25-12-2013
Long plateau at mag ~ 11.2
Main evolutions
Continuum almost constant
Changes in Balmer lines profiles
[OIII] and [NII] increase
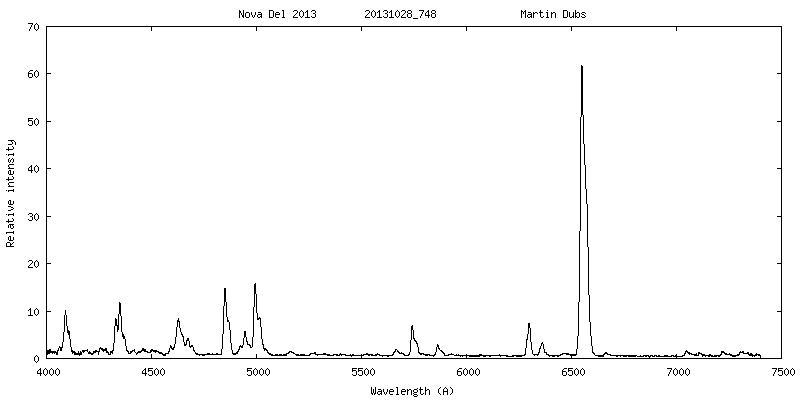
28-10-2013
Max +73 days
Mag V ~ 11.2 ( ~ Mag Vmax + 6.9)
M. Dubs LISA R = 1000
H alpha H beta H gamma (with [OIII] 4363)
[O I] 6300 and 6364 [O III] 4959 and 5007
by Steve Shore 28/29-10-2012 As you may know from the ATels, V339 Del was detected as a supersoft
source (SSS for short) last week. To explain, this is when the ejecta
are finally transparent in the high energy range of about 100 eV to 1
keV. Even though this would usually be thought optically thin because
you're talking about X-rays after all (Superman notwithstanding),
hydrogen has an enormous cross section at these wavelengths despite
their distance in energy from the ionization edge (13.6 eV, 912 A)
since the absorption cross section changes relatively slowly, by the
inverse cube of the energy (so at 500 eV the cross section is lower by
a factor of about 50000 than at 14 eV but there is so much hydrogen
that this can still be opaque -- the column densities are high). This
doesn't mean the source isn't there, on the contrary. As with the Fe
curtain phase, this is when the effects of the XRs within the ejecta
are observable even though there is no direct detection of the white
dwarf. The SSS is, as you recall, the signature of continuing nuclear
burning on the central object after the explosion, when residual not
ejected continues to process below the photosphere. The high
luminosities, this can be several thousand L_sun (hence enormous
fluxes), and low envelope mass (hence not an enormous in situ
absorption) leads to a photospheric temperature of a few 1^5K to 1E6 K
for the duration of the event. The larger the residual mass, the
longer the source is active. Its turn-on is at the same time as the
explosion, but it remains like a covered "hot pile" until the ejecta
finally thin out sufficiently to see the WD directly. The rise
observed by us, as external observers, depends on the line of sight
absorption, not the intrinsic absorption along a radial line to the WD
within the ejecta, so it's possible to see the central star before the
ejecta re completely thin if the ejecta aren't spherical (as is the
case here). The slower rise we see is just the unveiling of the
source along out sightline.Thisis why I'd recommended noting if certain lines, formed in the
ejecta at the periphery -- low density -- are detected: [Fe VII] 6086
and [-Fe X] 6378. The latter is hard in low resolution spectra since
it's blended with the O I 6364 line but it can show up. The former,
and [Ca V] 5307, are ideal optical indicators of the hot source but
they have to be emitting in those lines and, it seems from your latest
set of spectra, that this nova it isn't. Yet. They must be there
eventually.The nova was behaving very well, for a degenerate, until a week ago
when it went through a massive (factor of 10) increase in XR brightness
for a few days before returning to its originally smooth rise. The
spectrum also was temporarily very soft, meaning the range around 500
eV. The source, according to the Swift data we're collecting along
with your spectra, confirms the soft nature but the column density
indicated in neutral hydrogen is still an order of magnitude above the
interstellar value. A minor mystery that, but the flare is much more
intriguing. When the nuclear source is active, it seems to e decidedly
unsteady, showing factor of 2 or so variability over hours to days.
V339 Del is doing that. But such a singular brightening isn't normal.
Whether it's from the ejecta or the source depends on the radiative
transfer. At this point, I can't give you an explanation other than a
suggestion based on your spectra. There's been a dramatic shift in
the structure of the line on the blueward side. This significantly
affects interpretation of the XR data since it's the side of the ejecta
that shield the source. The rapid rise is likely the change in opacity
in the UV of the Lyman lines that have now allowed an increasing
emptying of the lower level of H-alpha so that side is completely
optically thin. The red side of the profile hasn't changed much if you
scale to flux (you can take the ratios of the profiles to see this in
velocity). If the change in the XRs is a transparency effect it
occurred very quickly, in a few days, that indicates an electron
density of about (3-4)E7/cm^3 for that portion of the ejecta. This
should have been seen in other lines and indeed it is -- the He II 4686
shows the same (!) profile as H-beta and H-alpha (comparing data from
Graha,m, Potter, Buil, and Guarro). The low resolution data is ideal
for showing the growth of the high ionization species.If it's an ionization event, a spurt of emission from the WD, this
would produce an ionization in the same timescale. So it will take a
bit more work to give you a definitive answer but the observations
you've all accumulated are a goldmine, this is -- yet again -- a stage
not previously seen in thsi detail. And one more, important finding in
your collective spectra: He II 4686 IS there [...]The XR monitoring is continuing, there should be more very high
resolution data when the weather permits at La Palma from the NOT
(they've had some bizarre humidity and wind in the last few days, an
observation on Friday failed) but as soon as it comes I'll write about
it. There is an HST/STIS spectrum in the woks for mid-November, this
should be the observation in the transition stage of the nova when the
ejecta are free of the Fe curtain and we will get the velocities and
abundances for the ejecta for the first time. There will also be an
XMM/Newton XR spectrum at almost the same time (around 15 Nov).29-10-2013
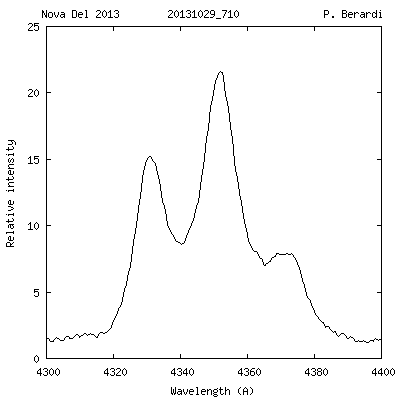
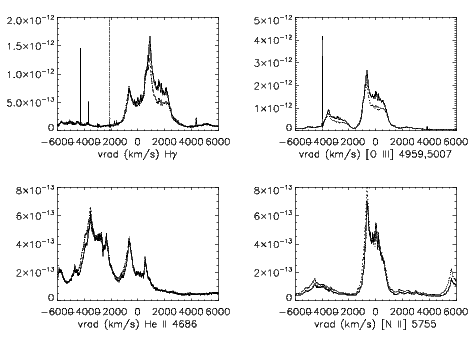
The Hbeta profile is the key for the Balmer sequence and you see there
are substantial differences with Halpha. This is an ionization effect
but I haven't sorted out the details. the Hgamma looks weird, and
that's another important indicator. It's blended with the [O III] 4363
line, the upper transition of the nebular triplet that gives a measure
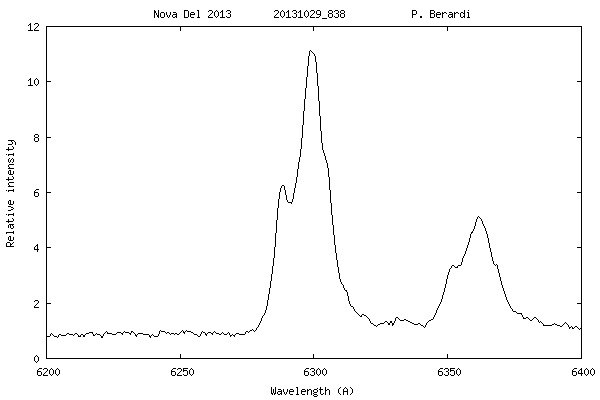
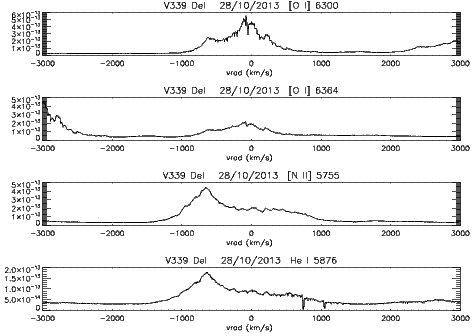
of the electron density. The profiles for the [N II] and [O III] and
He I lines are almost the same, but the [O I] 6300, 6364 are showing a
completely different, narrower, more symmetric form so the ionization
is clearly highly structured. Some of the features agree but it's
formed in a more limited velocity range
V339 Del was detected as a supersoft source (SSS for short) last week.
Hbeta profile is the key for the Balmer sequence and you see there
are substantial differences with Halpha. This is an ionization effect
He II 4686 shows the same (!) profile as H-beta and H-alpha
The profiles for the [N II] and [O III] and
He I lines are almost the same, but the [O I] 6300, 6364 are showing a
completely different, narrower, more symmetric form so the ionization
is clearly highly structured
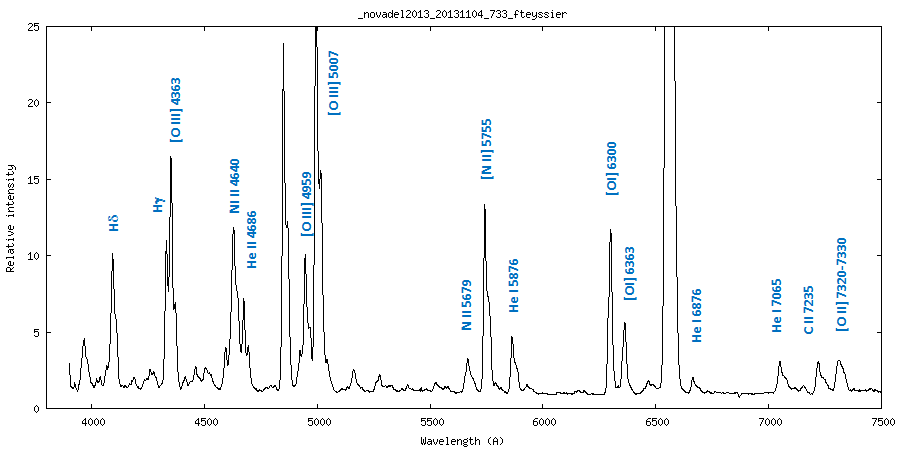
Publication in ATel#5546, Shore & al., 2013 Continuing spectroscopic observations (3600-8800A) of V339 Del = Nova Del 2013 in the early nebular stage with the Nordic Optical Telescope, Ondrejov Observatory and the ARAS group
We have been continuing almost nightly spectroscopic observations of V339 Del (see ATel#5378) with the 2.6 m Nordic Optical Telecope (NOT) FIbre-fed Echelle Spectrograph (FIES) (R ~ 67000), the Ondrejov Observatory 2m Zeiss coude spectrograph (R = 18000), and a variety of grating and echelle spectrographs of the ARAS group in the wavelength range 3684 - 7431A with resolutions ranging from 580 - 12000. As noted by Munari et al. (ATel#5533), the ejecta have now turned optically thin and entered the nebula phase but there are intriguing details. The strong lines include: [O I] 6300,6364,8446A, [O II] 7320/7330A, [O III] 4363,4959,5007A, C II 7235A and [N II] 5755A (the 6548,6583A lines are still strongly blended with Halpha), N II 4639, He I (especially 4471, 5876, and 7065), and He II 4686A (peak flux 5.9E-13 erg/s/cm^2/A on Oct. 28). He II was clearly present as early as Oct. 10 (but see Woodward et al. ATel#5493). There is no further indication of either Na I D or any Fe II (or related) emission in the spectrum. The line profiles remained nearly symmetrical and identical to the [O I] 6300A, 6364A lines until Oct. 11. A drastic change in the Balmer line profiles occurred between Oct. 12 (Day 59) and Oct. 14 (Day 61) -- the interval from -500 to -800 km/s increased by a factor of about 3 relative to the red wing (in the velocity interval 500 to 800 km/s). This transition occurred around the time of the supersoft X-ray detection (Osborne et al. ATel#5505). This same profile change was reproduced in all ionized species lines, only the [O I] lines have remained unchanged. On the Oct. 28 NOT spectrum (Day 76), comparisons of Hbeta and Hdelta reveals narrow emission features with halfwidths of ~100 km/s throughout the profile, suggesting that the broad emission is composed of individual knots with possibly low filling factor, the same narrow features appear on [N II] 5755A. The [O III] 5007A line blue and red peaks are at more negative (positive, respectively) velocities than Hbeta by ~150 km/s while the FWZI is the same for both profiles; the same contrast is seen with respect to [N II] 5755A, which shows a weaker red peak (500-800 km/s) than Hbeta. The He I triplets show a similar profile to Hbeta, the singlets (e.g., 5016A, 6678A) are either weak (showing only the -500 to -800 km/s peak) or absent. To date (Nov. 5), there is no evidence of [Ar III] 7135A, [Fe VII] 6086A or any higher ionization emission lines. A weak continuum is present, ~ 6E-14 erg/s/cm^2/A at 4000-7000A. At this point, the publicly available ARAS archive contains more than 1000 spectra, many flux calibrated. Based, in part, on observations made with the Nordic Optical Telescope, operated on the island of La Palma jointly by Denmark, Finland, Iceland, Norway, and Sweden, in the Spanish Observatorio del Roque de los Muchachos of the Instituto de Astrofisica de Canarias.
ARAS database for Nova Del 2013
15-11-2013
Max +91 days
Mag V ~ 11.2 ( ~ Mag Vmax + 6.9)
P. Gerlach LISA R = 1000
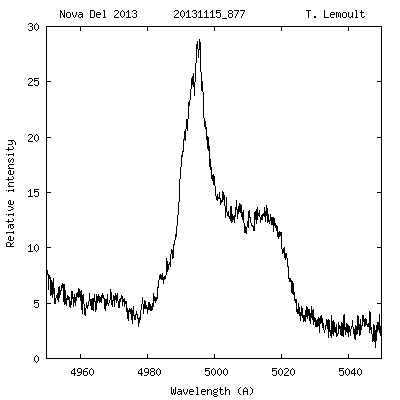
T. Lemoult eShel R = 11 000
First of [Fe VII] 6087
H alpha H beta [OIII] 5007
Lines identification
Steve Shore 18-11-2013
http://iopscience.iop.org/1538-3881/140/1/34/pdf/aj_140_1_34.pdf
is useful in this regard. Their "class P" is an extended state that
can last for a hundred or so days, this nova entered that hiatus a bit
earlier than many but not all. The odd thing is that most of the novae
on their list are either ONe or recurrent types. V339 Del doesn't fit.
It didn't show oscillations, or "outbursts" (short term increases
during maximum). There's one other analog, CP Pup (which,
interestingly, is one that Elena has been working on recently) that
could be similar. The transition to the SSS visibility was quite
abrupt, it would fit a high inclination to the line if sight that became
transparent with a rapid reionization (when the He II appeared) , but
that is just speculation now.Actually, many novae go through a protracted period of light curve
stability. For instance, V705 Cas, after the dust event, was very
stable for a long time. Now the XRs are at their peak, there were
oscillations for the first weeks but it seems to have settled down and
now there is a hint of a slow decrease in the soft band. I've been
keeping up with the spectra from the database, the low resolution is
difficult to judge in some cases because of the profile changes that
are not resolved except for He I 6678 which now shows the same profile
as the other He I lines (a lovely result from the last spectra from you
and Edlin).
21-11-2013
Max +97 days
Mag V ~ 11.2 ( ~ Mag Vmax + 6.9)
D. Boyd LISA R = 1000
H alpha H beta
Steve Shore 20/23-11-2013 20-11-2013
I've been working through the latest spectra. Just for the hell of it, I
ran a model for the [O I] and used it to see if the asymmetry in the
profile could be quantified. That's the enclosed figure. Using the
usual maximum velocity, 2500 km/s (from the UV) and comparing with the
observation from the NOT on 28/10, something interesting comes out.
There wasn't an attempt to fit things precisely. This time I used the
raw data from the model (no sum, no smooth, so this is one statistical
realization). If you normalize and subtract the profiles then the
lowest density region is on the red side; this is opposite the Hbeta
and Balmer profiles (and others too). So it seems to be a clue to the
asymmetries in the ejecta. Again the inclination is moderate, I
haven't yet done the full radiative transfer solution but that will
come after we have the STIS spectrum. As usual, I'm sort of shocked
when the models work so well, they really shouldn't be so precise!For the plateau phase, there can be several reasons, all of which are
connected with the interplay of the illumination from the WD and the
expansion. The density is dropping but the ionization is increasing so
there is a point where the emission lines (depending on which) can
remain constant. The higher ionization stages will be like this, your
plot of the [O III] is a good example. We don't yet have access to the
He II cleanly from the ARAS data, that's one of the hopes for the NOT
and Ondrejov spectra (to separate the profiles). If the [N II] is
constant, the N III 1751 and N V 1240 should be increasing. The
anomaly is always O I but the change in the 8446 line is important. An
interesting feature of the XRs is that they're now very stable, nothing
like the coronary we saw earlier in the month.There are two things that will be important to see now, and you all are
in the position to see it. The Halpha is so broad that he [N II] 6548,
6583 doublet is masked. That leaves only [O III] as a density
indicator. But in the next weeks, before the nova is inaccessible,
there could be evidence for the reformation of an accretion disk.
Even low resolution data will be important here. The He II line is
important, but the continuum is too. If the weather ever clears this
is worth calibrating, a signature is a rise toward the blue. We
haven't sen this with certainty in any nova to date but it has to
happen sometime!23-11-2013
The figure is the combined result of the (virtually) simultaneous
observation of the nova with the NOT (optical) and HST/STIS (UV). It
should illustrate why your low resolution observations are so
important, especially if they can be calibrated. This is a full
portrait of the energy distribution from about 1 to 10 eV (in other
words from between 0.1 and 1 micron). You see that now, when corrected
for an extinction of E(B-V)=0.2, the bulk of the emission is shortward
of the atmospheric (ozone) cutoff (almost by chance, it's the small gap
between the spectra). The strongest UV lines are N V 1240, O I 1302,
C II 1335, a complex feature at 1400 including Si IV, O IV, and
possibly S IV, N IV] 1486, C IV 1550, He II 1640, O III] 16667, C III]
1909, N II 2146, C II 2324, Mg II 2800 with the deep absorption lines
(that look like defects) all being interstellar absorption. We were
not able to get to 3300 A with STIS or we would have covered the O I
line near 3000 A, but there's enough to show the overall picture. Both
N and C are very strong, there's no Ne in any transition.As I'd written earlier, the UV is now where the flux is emerging, as it
was "inside" the curtain. The XRs are also a significant fraction o
the total. As a comparison, the nova is now about 30 times fainter in
the 1200-3000 A range than it was on 19 Sept when we took our first UV
spectrum, that amounts to a drop (equivalent) of about 4 magnitudes
(well, 3.7), with respect to the drop in the optical. This because the
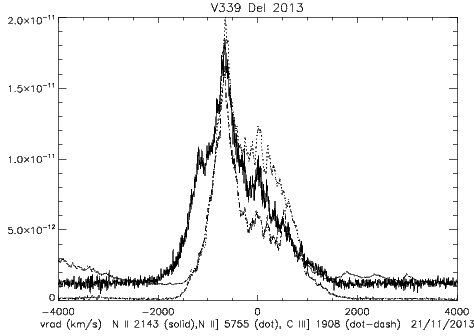
flux peak is shifting toward higher energies.The comparison of line profiles is also included to show how different
ions trace the structures when the ejecta are transparent. We're now
securely in the nebular stage so the lines, being optically thin,.
provide a view through the entire ejecta.
I ran a model for the [O I]
and used it to see if the asymmetry in the
profile could be quantified.
UV and visible spectrum (STIS + NOT) 21-11-2013
The figure is the combined result of the (virtually) simultaneous
observation of the nova with the NOT (optical) and HST/STIS (UV
The comparison of line profiles is also included to show how different
ions trace the structures when the ejecta are transparen
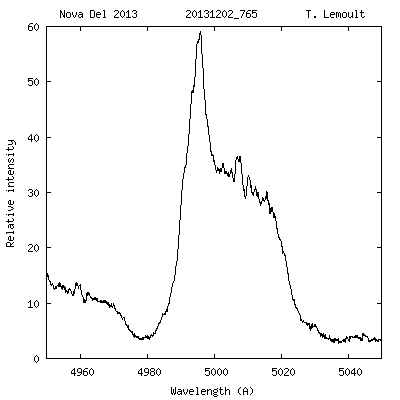
02-12-2013
Max +108 days
Mag V ~ 11.2 ( ~ Mag V max + 6.9)
J. Ribeiro Alpy R = 600
T. Lemoult eShel R = 11000
H alpha H beta [O III] 5007
Nebular phase by Steve Shore 30-11-2013 We are now well into the nebular phase We are now well into the nebular phase. The emission lines of all
species show ionization-dependent structures but within a single ion
the profiles are the same. This maps the ejecta structure and leads to
a three dimensional view that is especially important (for instance, in
comparison with HR Del 1967 for which the ejecta are superbly
resolved). A STIS/HST spectral sequence (1150 - 3050A) with a
resolution of > 30000 was obtained simultaneously with a NOT
observation (3700-7400A), an XMM/Newton XR pointing, and a number of
your spectra. What's emerged from the UV is hat the emission lines are
all asymmetric, with profiles similar to that seen in the optical (with
the -1000 km/s peak stronger or dominant relative to +1000 km/s; for [O II]
only the blue is seen) and that all of the ions with ionization
potentials above He I (about 25 eV) have the same profile. There are
no absorption lines other than interstellar, but those are a key to
setting the continuum level since they're purely absorption and
entirely foreground (not in the ejecta). This shows that a continuum,
seen in the optical, is present and strong in the UV. At this stage,
it's likely a mix from the white dwarf and the thermal emission from
transparent gas in the ejecta. If it's due to the WD, which is now a
strong (but as of today slowly declining) supersoft source (SSS), then
it indicates an intermediate temperature since the slope in the UV band
is quite visible. As a side note, the hotter the central source the
more uniform the continuum in longer wavelengths will be singe the
strongest change is near the maximum. While for now this seems just a
technical point it's much more. The UV+optical luminosity, if a
distance of 4+/-0.2 kpc assumed (which we have from the comparison with
OS And 1986) and a reddening of E(B-V)=0.2, then the luminosity is the
entire spectrum at lower energy than about 13 eV (i.e. roughly the
ionization of neutral hydrogen) is only about 2000 L_sun or less. The
XRs are very bright, the reported uncorrected integrated flux from
Chandra is about equal to the UV/optical corrected value so it must be
much stronger. A hopelessly naive assumption, that the emission
behaves like a blackbody, provides a clue (but one to take -- as for
any comparison with a Planck function -- with much caution) is that
only about 5% of the flux has been measured in the longer spectral
interval so the luminosity could really be quite high. In the absence
of any spectral indicators of the WD temperature (or even presence
other than the XRs) it's still a "to be seen eventually". Some lines
might be masked by ejecta emission, for instance, but that could remain
true for months to years.You might be wondering if an accretion disk has reappeared yet. The
0.1-10 keV range (reported for Chandra observations by Nelson and
collaborators) shows nothing in emission! OK, there's a reported
continuum but there are no P Cygni type lines (indicative of a stellar
wind). On the contrary, strong absorption was seen (this about a week
before the STIS observations) . That's not so remarkable if it is
photospheric, but all lines are blueshifted (!) by 1000 km/s or so.
Strangely, this is the same velocity at which we see the asymmetric
emission peaks. So think of what would happen if the outer ejecta,
which have lower number density and higher expansion velocity, are
nebular (transparent) but the inner, hotter parts of the ejecta are
still marginally optically thick in the lines. Then what you should
see are lines shifted, uniformly and completely, to the velocity of the
inner ejecta. In this case, it's reasonable to take 1000 km/s. Thus,
and this seems to very lovely part of the future work, as these
features turn from absorption (by absorption I also include optically
thick resonance line scattering) to optically thin emission, we will
get a new, independent estimate of the mass and abundances in the
ejecta. To encourage you, the Chandra and XMM/Newton data have about
the same resolution in XRs that you are getting in the optical. I may
have mentioned that in T Pyx this was detected only very late, after
300 days, and here we have nothing in the intermediate ions (e.g. N
IV]1487, N IV]1718) that we saw in detached absorption features, but
it's a new and essential probe of the ejecta. If this works, it will
allow precise information to be obtained about heavy element
abundances, the yields from the explosions, the correctness of the
nuclear reaction modeling (nucleosynthesis is the sort of radioactive
waste from a reactor gone bad, as you all know). There's been one
claim that dust formed (when have you heard that one before?) but t's
likely a red herring (we'll know once there's a SOFIA flight, the
aircraft is grounded now for engine problems).So what we have is: excited state transitions: O V] 1371, N IV] 1718,
He II 1640; some of the strongest UV transitions detected: N V 1240, O
I 1302, C II 1335, N IV] 1486, C IV 1550, He II 1640/2733, O II] 1667,
N II 2143, C III 2297, O II 2470, O IV 2510/2517, Mg II 2800, C II
2837, F III 2932. The complex blend at 1400 is primarily O IV 1401 but
likely has a contribution from S IV; the Si IV doublet is absent.There's nothing particularly remarkable about the nova properties, the
electron density is now about 1E7/cm^3 (so still marginally high),
there's an indication that the filling factor (the knottiness of the
ejecta, as seen on your profiles o Halpha, for instance), is about
0.1-0.5 (in other words, not large, not small, intermediate), and the
ejecta mass is about a few 10^-5 M_sun, consistent with other classical
novae but that will become more precise soon. Once this is all over,
the next step is the detaled abundance analysis, He line profile
modeling, and the writeup of the first paper.Your spectral sequences will be the check against which all detailed
modeling will be done since the density, quality, dispersion, and
coverage make then precious.
Spectra STIS (UV) and NOT (Optical)
08-12-2013
Max +114 days
Mag V ~ 11.2 ( ~ Mag V max + 6.9)
F. Teyssier Lisa R =1000
S. Charbonnel eShel R = 11000
H alpha H beta [O III] 5007
Simultaneous high resolution ultraviolet (HST/STIS) and Nordic Optical Telescope spectroscopy of V339 Del = Nova Del 2013
In our continuing campaign of observations of V339 Del = Nova Del 2013, we have obtained simultaneous spectroscopy with HST/STIS (medium resolution echelle, 1150 - 3000A) (ATel#5409) and the Nordic Optical Telescope (FIES high resolution echelle, 3800 - 7400A) on 2013 Nov. 21. The nova was well into the supersoft phase at the time of the observations (ATel#5573), and showed a countrate with the Swift XRT of about 32 c/s at the time of the HST observation. The spectra show that the nova is now in the nebular stage with the dominant optical lines being hydrogen Balmer, He I, He II, O III] 4363, 4959, 5007, [N II] 5755 (the 6548,6583 doublet is still severely blended with Halpha), and N III 4636. The rich emission line spectrum also includes the [O I] lines at 6300, 6364. The Balmer profiles are similar to those of He I: asymmetric with the blue side of the line being about a factor of two stronger than the red and FWZI of about 4000 km/s. The STIS UV spectra show a broad range of ionization stages. The excited state transitions O V] 1371, N IV] 1718, and He II 1640 show almost identical profiles, two peaks at around -600 and +600 km/s (as for the optical lines) with the blue to red peak ratio of about 3. Some of the strongest UV transitions detected (with uncorrected integrated fluxes in units of 1E-11 erg/s/cm^2): N V 1240 (22), O I 1302 (0.8), C II 1335 (4.8), N IV] 1486 (16.3), C IV 1550 (32.0), He II 1640 (2.4), O II] 1667 (2.9), N III] 1750 (17.0), C III] 1910 (28.0), N II 2143 (2.3), C III 2297, C II 2324 (5.5), O II 2470, O IV 2510/2517, He II 2733, Mg II 2800 (1.3), C II 2837, F III 2932. The line profiles vary systematically, the neutral lines have a FWZI of about 2500 km/s (e.g. O I] 6300, 6364) while the higher ionization lines, and the Balmer lines, show FWZI ~ 4000 km/s (e.g. N IV] 1487, C II] 1910). The complex blend at 1400 is primarily O IV 1401 but possibly has a contribution from S IV; the Si IV doublet is absent. The stronger peak on the blue side of the line, at around -600 km/s, is at about half the radial velocity of the H and He-like ions reported in absorption from the Chandra observations (ATel#5593). If this is absorption from the ejecta instead of from the white dwarf photosphere, it would explain the systematic asymmetries in the higher ion profiles (the neutral and low ionization potential species are more symmetric and narrower in velocity). The filling factor of the ejecta appears to be moderately high, around 0.1 to 0.5, even though all strong profiles show discrete emission features with FWHM ~ 200 km/s. These are consistent across all of the permitted and intercombination transitions; the forbidden lines (e.g. [O III] 4959, 5007) show far lower contrast between the discrete features and the broader profile and a greater ratio of the blue to red emission peak at +/-600 km/s.
The Lyman alpha profile is consistent with only interstellar absorption with N_H ~ 1E21/cm^2. Based on observations made with the Nordic Optical Telescope, operated by the Nordic Optical Telescope Scientific Association at the Observatorio del Roque de los Muchachos, La Palma, Spain, of the Instituto de Astrofisica de Canarias. The research leading to these results has received funding from the European Union Seventh Framework Programme (FP7/2007-2013) under grant agreement No. 312430 (OPTICON).
22-12-2013
Max +114 days
Mag V ~ 11.2 ( ~ Mag V max + 6.9)
J. Ribeiro Alpy600 R =600
S. Charbonnel eShel R = 11000 (20-12-2013)
H alpha H beta [O III] 5007
by Steve Shore 17-12-2013
spectra that hinted at this, there is definitely [Fe VII] 6087 with the
He II 4686-type of profile. The line wwas likely already detected a
month ago, when the SSS was strong after the first oscillations, but
the profile was weak and there was only a hint at lower resolution.
[...] The only changes are on the inner
(|vrad|<1000 km/s) portions of the Balmer lines and other permitted
lines, but large changes (50%) in the blue to red ratio for the
forbidden lines (e.g. [O III] 4363, 4959, 5007, almost none for [N
II]). Still too broad an Halpha to distinguish the [N II] 6548.6583
lines but the Balmer lines are narrowing slowly. There's still a
strong continuum, essentially invariant since the last observation
with NOT on 21/11. No new features, the [Ar III] 7135 is very weak if
present.
... confirming the ARAS spectra that hinted at this,
there is definitely [Fe VII] 6087 with the He II 4686-type of profile
Assessment by Steve Shore 28-12-2013 So we arrive at the end of the year and the of the visibility of V339
Del for this year. It should come out from solar avoidance again in
March. In the interim, as you all know, in this past month it's been
surpassed - in brightness - by V1369 Cen, discovered about four
weeks ago. Before continuing, there is one important thing to note
here: without this campaign, V1369 Cen would be studied in a vacuum.In the past month, during the last stages of fading of v339 Del, we've
seen -- finally -- the higher ionization stages of the ejecta. From
your spectra and from the NOT, there are indications of the [Fe VII]
6087 A line as early as mid-Nov. but this is now clearly resent and
ill be the ``line to watch'' in the months after emergence from sola
obscuration. The He II 4686 A line is strong and of a similar
profile, indications that the ionization and emission are still powered
by the continuum of the central engine (the WD). Now, depending on the
development of the X-ray emission -- whether the source is still ``on''
when we see the nova again in the early spring or has shut down and is
in the cooling phase -- the ionization of the ejecta will display
changes dominated by the interplay of expansion and photo-processes.Perhaps now we can reflect on what we don't know from all we'e
collectively seen and learned this nova because it prepares us
collectively for all those to come.For V959 Mon 2012 we had the disadvantage of not having seen the peak
of the outburst, the mirror image of what's happening now for V339 Del.
Having missed the Fe-curtain phase, we did not see the earlier
optically thick stages of the ejecta that probed the recombination
following the fireball. Instead, for V339 Del, we have an exquisite
picture, in minute detail, of every moment of that period. It shows
that many of the phenomena seen in the earlier outburst of the
recurrent nova T Pyx, in 2011, are not peculiar to that system
but actually generic. The structure that you observed in the
absorption troughs of the P Cyg lines, the disappearance and then
re-appearance of the detached absorptions on the He I profiles, the
Na I doublet complexity, are all standard features. Now, for V1369 Cen,
we're seeing the same thing, albeit with more complex structure and
higher velocities. But why ? What imposes this feature of the
ejecta? The narrow lines are well known from other novae but the
optical depth changes show that what starts out as a broad (hundreds of
km/s feature decomposes on a drop in column density into an
ensemble of individual components. It appears that the filamentary
character of the ejecta is far more complex than it seemed. But there
is larger scale structure, otherwise we wouldn't see these
distinguished features. The same lines appear on the Ca II H and K
lines, ion resonance lines, as Na I, despite these being different
ionization states they are both from high column density, low
temperature gas. Again, why? There has to be something pointing back
to the explosion.In V1369 Cen we're seeing a very complicate light curve, one that is
reminiscent of T Pyx in its excursions in V. The gamma-ray emission
we saw in V339 Del, and V959 Mon (remember, this character was first
seen in very high energy emission months before it as detected
optically, was confined to a brief interval near peak. For V1369 Cen
that's not so clear. But perhaps the difference in the photometric
development -- along with the line profile changes -- will allow an
eventual resolution of the structure question.The second is for the future. V339 Del was spatially resolved very
early, within a week of outburst, at optical and near infrared
wavelengths. That data has yet to be digested thoroughly but for now
it seems consistent with different interferometers (CHARA in the north,
VLTI in the south) found different expansion rates that could indicate
an axisymmetric (bipolar) sort of structure. When the nova emerges
again, it will be after almost as long an absence as its presence, so
it should be considerably more extended and may be accessible to
direct imaging from groundbased telescopes like the Keck, VLT, or
Gemini. The same is true for V1369 Cen, although there is no northern
partner to provide that information. It isn't unthinkable that a
direct comparison will be possible with HR Del 1967, for which
HST/WFPC2 images were obtained in the '90s (nearly 30 years after
outburst). Remember, once the central source ceases to control the
ionization the gas continues to radiate by recombination, although
always more weakly, so the line emission traces electron density. The
advantage of brightness, of nearness of the nova, is purely geometric
-- the closer it is, the easier the resolution of the ejecta. The same
holds for the radio, interferometric observations of V339 del are the
basis for interpretation of the more sparsely sampled V139 Cen
cm-wavelength data.The third is sill open: there is now accumulating evidence that V339
Del really did for dust although it isn't yet clear how much.
The latest observations, by Fred Walter using near infrared spectra,
is in strong support of that contention from earlier bolometer
photometry in the IR by the Minnesota group. How much and where, and
when isn't known -- yet -- but you all worked like daemons to cover the
CN lines during the optically thick stages and nothing emerged.
Neither was CO observed in the IR as it was for V705 Cas. So there is
a crack in the edifice, perhaps molecular precursors are not necessary
-- or are not visible -- if the ejecta have the right geometry. The
dust didn't produce a DQ Her-type event, but the ejecta aren't
spherical, so now to see what happens in V1369 Cen. I wish I could
give you all a neat summary of this but it's new territory, as we've
seen so often in this nova.
Comparison of Nova Del and Nova Cen 2013 at approximativly the same stage
The line profile changes in the last month for V339 Del trace the
electron densities. There is a hit of the [N II] 6583 A line
(the analog of [O III] 5007 A on the wing of H alpha and a first
trial in getting the electron density by using the ratio [N II]
(6548+6583)/5755, along with the tracer [O III] (4959+5007)/4363,
gives a limit on the density in the range between -1000 and 1000 km/s
of (6-10).10^6 cm-3 but the temperature is uncertain.
OK, this is a technical point but by combining the emission
from lines whose de-excitation is from collisions with electrons in the
ambient gas and otherwise only radiative de-excitation, the branching
ratio (ratio of the different ``exit channels'' for the photons) shows
the competition between the rates of collisional de-excitation and
radiative decays for the excited states. The advantage of these two
indicators, even if they arise from different ions, hence from
different parts of the ejecta, is that they're similar enough
that the differences can be understood by using the line profiles. You
see, that's why spectra are so important -- in such rapid expansion,
with so large a velocity difference between the inner and outer parts
of the ejecta -- every piece of the volume leaves its radiative imprint
projected along the line of sight. So if two profiles are similar in
structure, they come from the same places in the ejecta and the
differences are because of the peculiar sensivities to the ambient
conditions of the transition in question. None of this is handwaving
-- we have mow the necessary plasma diagnostics to proceed
systematically with the time dependent analysis of the ejecta.Here we turn again to the homogeneity problem: is the gas well mixed or
not? What happened during the explosion?? If V1369 Cen is showing
multiple ejection events, the comparison with V339 Del will be an
incredible chance to see if individual events are similar in the
nuclear waste produced and expelled. We can, irrespective of
whether V1369 Cen is a O or ONe nova, to do a quantitative
compare-and-contrast analysis with any of the subtypes based on the
last three years of novae. Here I really mean we, you're all
part of this! Those observing V1369 Cen now, those who have followed
with such zeal V339 Del.This has gotten very long and it's really only the beginning. The pair
will remain visible for years at a level accessible even with
small telescopes, albeit at low resolution. It will be worthwhile
trying to restart observations when V339 Del re-emerges, we don't know
what it will be in V at that time. And now it's time to reflect on all
that's been accrued in this spectacular archive and begin the detailed
analysis. You're all part of that now. Fr those who have had the
stamina to reach this point in the notes, for a whole community that
has reaped the rich rewards of your collective effort, sincere thanks
from the heart for ll you have done. The first paper is now being
outlined, that will be sent around to you, and summaries of the
analysis will be coming in the next month.The new year begins with a new era in the study of this elusive
phenomenon. You are all the ones who have made that possible, turning
voyeurism into a fine art through spectroscopy and thought.Best wishes for the holiday and very best wishes for the New Year.
See Also Nova Del 2013 Topic on ARAS Forum
References/Publications
| Page built by François Teyssier - 26-12-2013 |
|---|