NOVA Cyg 2014
An amateur spectroscopic survey of a peculiar Nova
|
|
NOVA Cyg 2014 An amateur spectroscopic survey of a peculiar Nova |
||||||
|---|---|---|---|---|---|---|---|
| update 30-05-2014 |
|
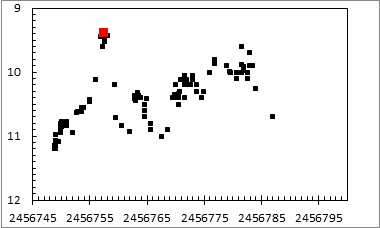
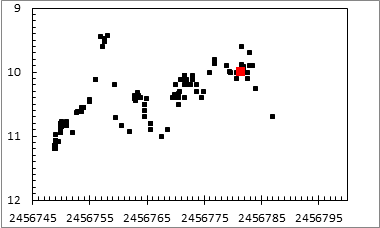
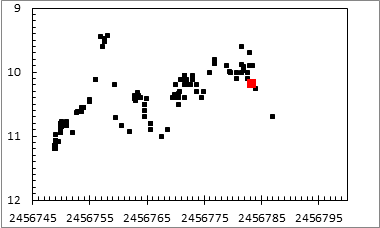
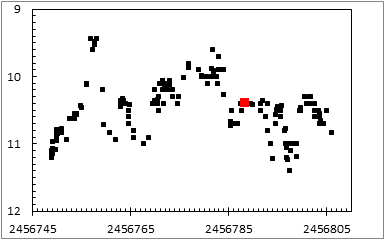
The peculiar lightcurve of Nova Cyg 2014
red dots = ARAS Spectra
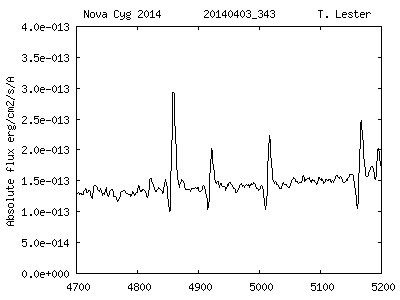
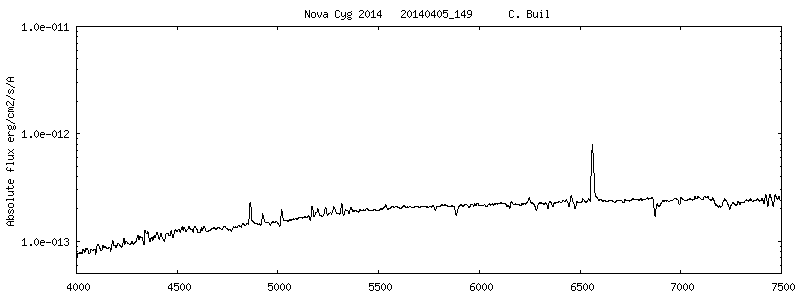
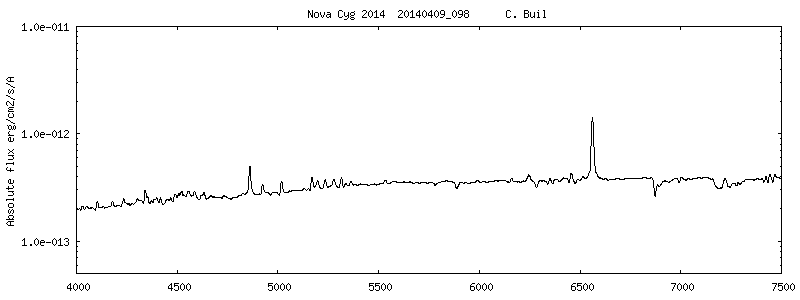
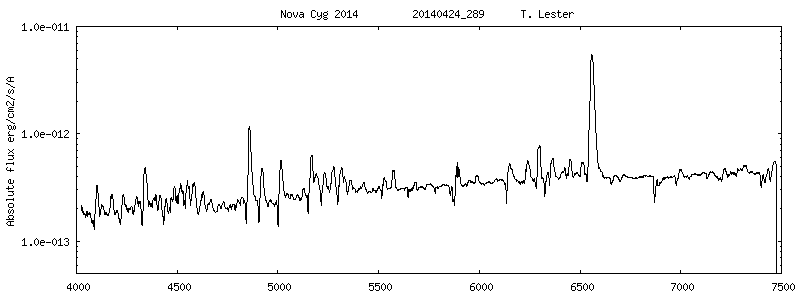
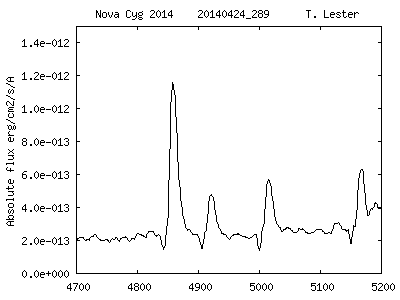
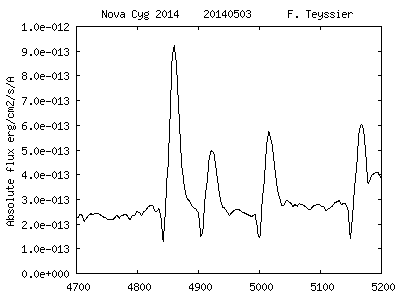
Selected spectra from ARAS data base
The spectra are flux calibrated, using AAVSO data base (V band)
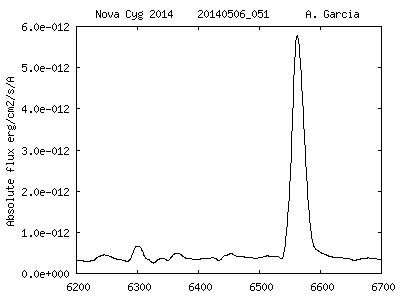
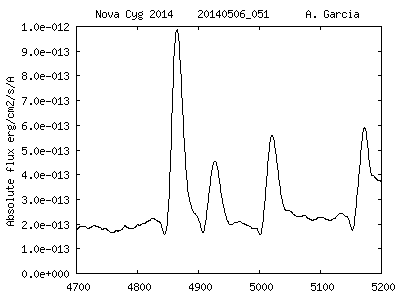
| AAVSO Light curve (V + Vis.) | Full optical range [4000-7500 Å] Flux : Logarithmic scale | H alpha | H beta |
 |
 |
 |
 |
 |
 |
 |
 |
 |
 |
 |
 |
 |
 |
 |
 |
 |
 |
 |
 |
 |
 |
 |
 |
 |
 |
 |
 |
 |
 |
 |
 |
 |
 |
 |
 |
 |
 |
 |
 |
 |
 |
 |
 |
 |
 |
 |
 |
 |
 |
 |
 |
 |
 |
 |
 |
 |
 |
 |
 |
 |
 |
 |
 |
 |
 |
 |
 |
 |
 |
 |
 |
 |
 |
 |
 |
 |
 |
 |
 |
 |
 |
 |
 |
Step by step evolution
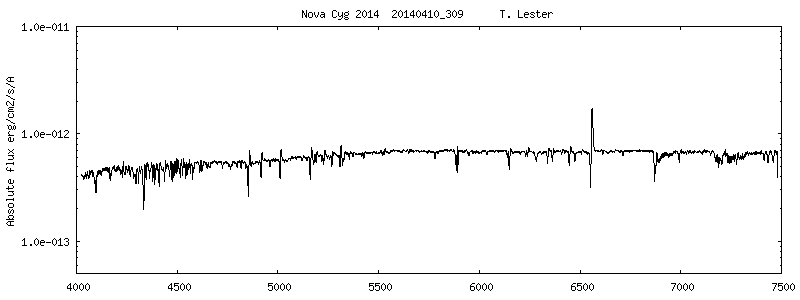
After the classical rapid rise in luminosity, the slope changes between JD 2456750.0 and JD 2456754.9 During the premaximum halt (?), the absorptions disappear. |
|
 |
| At maximum luminosity, emission lines vanish and strong absorptions reappear. |
|
 |
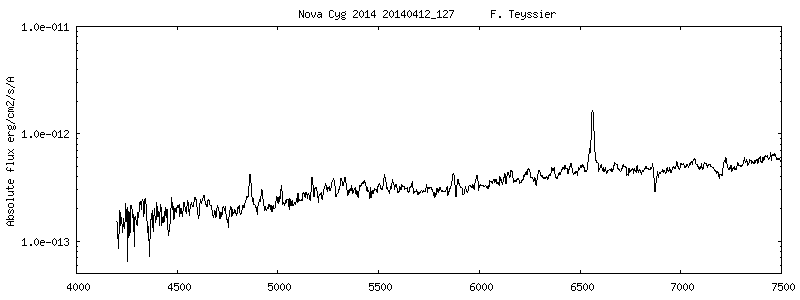
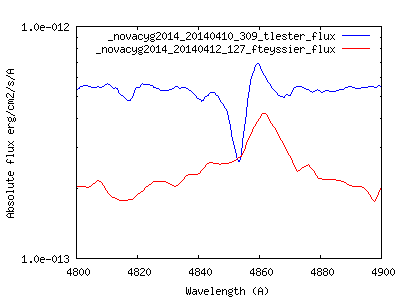
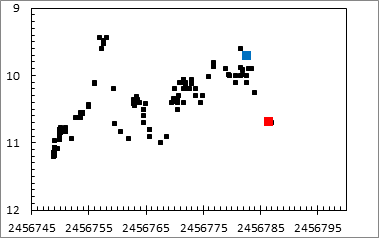
The maximum is followed by a very fast decline from Mag V = 9.4 to 10.8 (14/04/2014) in four days (about 0.35 mag/day) During this first phase of this decline, absorptions disappear. The Balmer lines evolve : a broad piedestal (FWZI = 2700 km/s) appear. |
|
 |
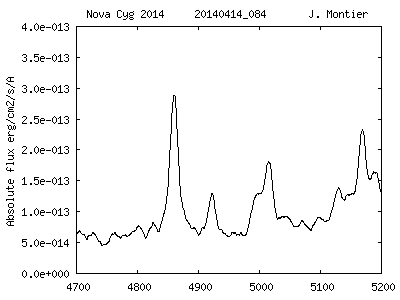
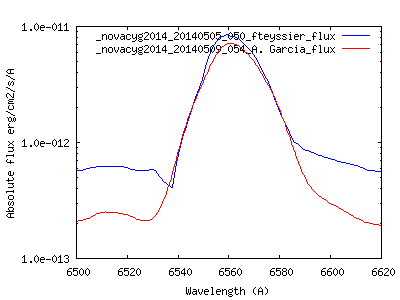
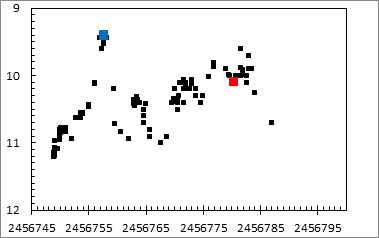
| At the minimum (JD 2456761.9), 4 days (V = + 1.5 mag) after maximum the emission lines are broader |
|
 |
|
 |
|
|
 |
|
|
 |
|
|
 |
|
|
 |
|
Evolution of the absorption system
 |
 |
 |
|
|
 |
 |
|
 |
 |
 |
|
 |
 |
 |
|
 |
 |
 |
|
List of observers
C. Buil O. Garde A. Garcia P. Gerlach T. Lester J. Montier F. Teyssier


