
Spectrography is one of the key disciplines of astronomy, perhaps even the most significant. Indeed, the essence of our physical knowledge of the stars comes from the spectral analysis of light which we collect with our telescopes. However spectrography is not well thought of by amateur astronomers. It has the reputation of a difficult, dry, inaccessible technique. The few images which follow show that it is nothing of the sort if the subject is well approached and if one retains modest performance expectations. This study was carried out within the framework of the Audine program with an aim of producing a very luminous spectrograph to carry out multispectral photometry of supernovas, quasars and comets, with amateur telescopes.
The majority of spectrographs use a beam splitter. This optical component has the property of bending light which crosses it to different angles depending on wavelength. The best-known beam splitter is the prism. The mechanism of dispersion is the variation of the angle of refraction which is a function of the index of refraction of glass, which itself varies depending on wavelength. It is also refraction which explains rainbows, the light in this case being bent in a complex way by the water drops of a downpour.
The other significant family of beam splitters is based on light diffraction when it crosses a fine periodic structure or is reflected on a structure of this type. These are diffraction gratings. The coloured irisations observed in the light reflected by a compact disc originate in a diffractive phenomenon, the periodic structure being here the fine furrow left by the laser which engraved the disc.
The simplest spectrograph that one can build uses the only beam splitter which one places directly in the convergent optical beam of the telescope, near the focal plane, i.e. CCD sensor. No need for slit, collimator and other objective to generate a completely suitable spectrum. This simplification has of course a price. A spectrograph based on a beam splitter in the convergent beam cannot claim to compete as regards resolution with the more traditional assembly of the spectrograph with slit. On the other hand the ease of realization is beyond measure.
The figure below shows how to lay out the beam splitter, here a grating, in
the optical beam. The polychromatic light coming from a star in the field is
bent while crossing the grating to form a spectrum in the plane of the CCD.
In the figure only 3 rays of light corresponding to 3 distinct wavelengths are
traced. In practice, the number of wavelengths is infinite and a continuous
spectrum is observed. Another star in the field will produce a spectrum in the
same manner, but this one will be shifted spatially. It will be the same for
all the other objects in the field: galaxies, asteroids, novae... It is seen
that this spectrograph makes it possible simultaneously to acquire the spectra
of a very great number of objects, and that is not the least of its advantages.
Comparatively, a spectrograph with slit will allow only one object to be studied
at the same time.
Farther still one finds higher orders, but they are too weak to give a visible signal in this reproduction of the CCD image. The orders cause artifacts because of their recovery. For example, the wavelength 8000 A in order 1 is superimposed on the wavelength 4000 A in order 2. As a simplification, it should be considered that the spectrum with order 1 is not exploitable beyond 8000 A because of this phenomenon with the CCD. The grating is a simple photographic Cokin N°40 special effect filter placed 40 mm in front of the Audine camera.


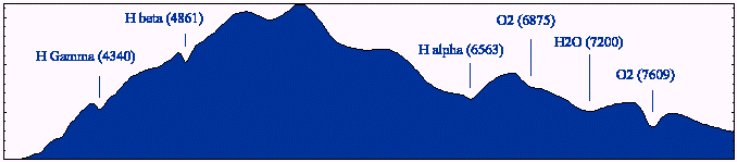
The spectrum of the figure above is limited spectrally by the response of the CCD. On left the spectrum begins in blue from approximately 3900 A. On right-hand side, the spectrum disappears in the infra-red around 1 micron wavelength (in the figure the spectrum is voluntarily stopped in the neighbourhood of 8000 A because of the problem of recovery of order). Between these two end points the curve varies in a complex manner, and many variations of intensity in the spectrum must originate with the CCD itself. A significant part of processing of spectra consists in eliminating this contribution of the detector, but also that of the transmission of optics or that of the output of the grating which also varies with wavelength.
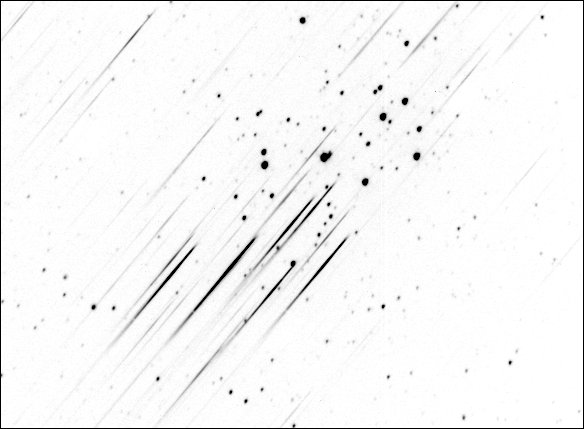
The image below shows the area of planetary nebula NGC 2392 (the Clown nebula) obtained with a Jeulin grating with 100 lines/mm placed 21 mm in front of the significant surface of KAF-0400 CCD of the Audine camera. The telescope is a flat-field camera of 190 mm to F/d=4. The final image is a composite of 10 2-minute exposures.

 Examples
of spectral profiles obtained with the Jeulin grating of 100 lines/mm placed
at the opening of a telescope 190 mms in diameter. The spectrum in green is
that of the star Delta Cassiopée, of type A5. The Balmer series of hydrogen
is quite visible. In red, one finds the spectrum of the star Gamma Cassiopia,
of type B0e. The line of hydrogen H alpha appears there in emission very strongly.
The exposure times are 30 seconds. One sees here how a grating costing about
100 Fr ($13 USD), placed simply at a few centimetres in front of the camera,
makes it possible to perform good physics!
Examples
of spectral profiles obtained with the Jeulin grating of 100 lines/mm placed
at the opening of a telescope 190 mms in diameter. The spectrum in green is
that of the star Delta Cassiopée, of type A5. The Balmer series of hydrogen
is quite visible. In red, one finds the spectrum of the star Gamma Cassiopia,
of type B0e. The line of hydrogen H alpha appears there in emission very strongly.
The exposure times are 30 seconds. One sees here how a grating costing about
100 Fr ($13 USD), placed simply at a few centimetres in front of the camera,
makes it possible to perform good physics!


The spectrum of double system NGC 3690 (ARP 299) carried out with the same instrumental configuration as for the preceding image. It is a composite of 37 images exposed 120 seconds, that is to say a cumulative time of integration of 1 hour and 10 minutes. The spectrum of the core of these active galaxies clearly shows an emission line (note that at the time of the exposure, 28/01/1999, a supernova of magnitude 16.5 was just on the right principal core of NGC 3690, but it was inaccessible to this spectrograph since it was too weak). The wavelength measured for the emission line is 0.6740 micron. If it is the H alpha band presenting a P-Cygni profile and normally at 0.6563 micron, but shifted towards the red because the speed of recession, then measured radial speed is of 8000 km/s whereas the galaxy is announced to have a radial speed of 3000 km/s. The variation can be explained by an erroneous identification of the band or a strong deformation of the band because of high speeds of expansion in the core. On this document it is possible to exploit star spectra up to magnitude 14.8. If the object presents emission lines, it is probably possible to go down low in magnitude. It should be stressed that in the assembly used, the spectrum appears in superposition with the background of sky. Working with a quite dark sky, it is possible to reduce the proportion of noise added by the level of the background of sky (all the observations of this page were carried out in urban environment). The estimated gain is 0.5 magnitude. By using under these conditions a telescope of 300 mm, one calculates that it is possible to acquire measurable spectra at least up to magnitude 16.5. It is seen that the objective of observation of supernovas or quasars with this simple device is not utopian.
 |
 |


|
|
|
|