"Virtual Moon Atlas"
Documentation for all versions available
on September 1st 2005
(This english version has been partially corrected by Jim Gartner. Thanks, Jim for your help !)
Welcome to the "Virtual Moon Atlas".
As amateur astronomers, we have tried to create a useful program for Moon observers and for "on the field use". We try to create functions and interface for ease of use.
The "Virtual Moon Atlas" is available under three versions :
- "Light" version is usable with slower hardware configurations
and presenting a 2D display
- "Basic" version usable with medium hardware configurations
and presenting a 3D Nearside display
- "Expert" version usable with medium hardware configurations
and presenting a 3D Nearside and Farside display
- "Pro" version usable with powerful hardware configurations
and presenting "Expert" functions plus scientific overlays and
double window display
A manual is nevertheless necessary to discover all the software possibilities because they are always more numerous. We would like you to read the documentation while you try to use the indicated functions. The functions available in each version are clearly indicated.
Have fun, and we hope you enjoy using the program and will recommand it to your friends.
Thank you very much for your confidence.
Christian Legrand and Patrick Chevalley
THE "VIRTUAL ATLAS OF
THE MOON" SCREEN
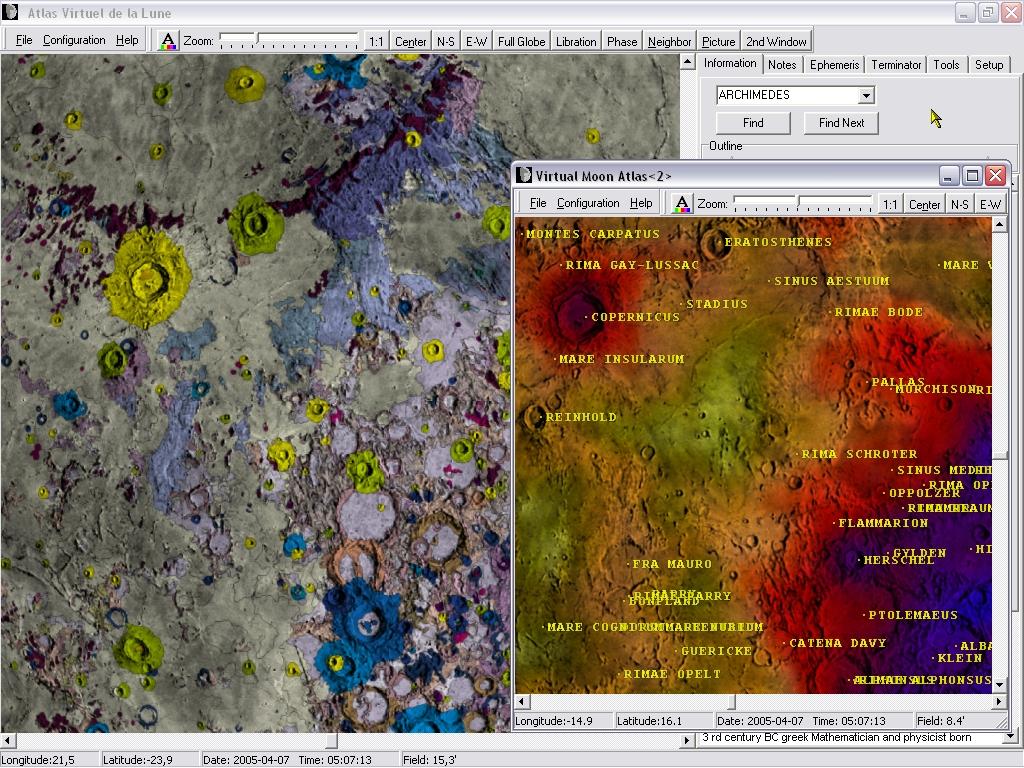
"Pro" version screen with dual window
"Virtual Moon Atlas" (VMA) screen appears in a Microsoft "Windows"
window. As usual, you can minimize or maximize the window, or
choose its size with the buttons in the title bar, on right.
In the "Pro" version, you can open simultaneously twice VMA, permitting maps comparisons as on the picture above.
Main window presents:
- Menus and buttons bar
- Map window
- Information window
- Thumbnails "Information", "Ephemerisis", "Notes",
"Toold", "Settings" and "Terminator" and
the associated windows.
- Additional windows, such as "picture" windows or "neighbourhood"
window, that can be superimposed on the previous elements.
THE MENUS AND BUTTONS BAR (All versions)
![]()
This bar (Version "Pro" above) presents menus to access different functions and buttons to quick launch of some other useful functions.
THE "FILE" MENU (All versions)

Traditional in all Windows softwares, this menu is used here to save screen pictures, to setup printing, to launch Patrick Chevalley's freeware "Sky Charts" if it's installed on your computer, and to quit the atlas.
"Snapshot" FUNCTION (All versions)
This function can open a new small window containing a map window capture. You can compare this capture with a new configuration applied to the map window.
"Save as" FUNCTION (All versions)
This function permits you to save the "Map" window as a .jpg or a .bmp file
"Printer setup" FUNCTION (All versions)
This function permits you, with the use of the regular window selection, to choose your printer and to setup it.
"Print" FUNCTION (All versions)
This function allows you to print the documents you chose in the printed documents (Map, ephemeris and / or information page).
"Sky chart" FUNCTION (All versions)
This option is used to launch Patrick Chevalley's freeware "Sky Charts"
to determine Moon position according to stars and horizon. It can help
you for star occultations for example.
"Quit FUNCTION (All versions)
You can leave the software using this option, closing all the open windows together.
THE "CONFIGURATION" MENU (All versions)
This menu is used to adjust different parameters in VMA. It presents eight thumbnails
"General" THUMBNAIL
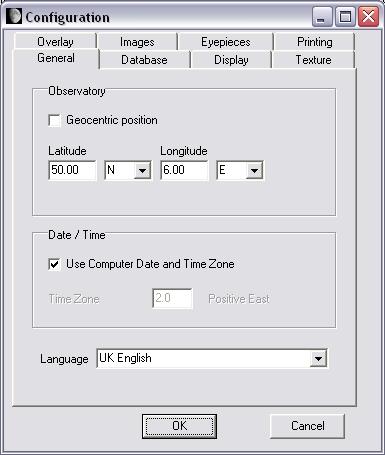
Observatory coordinates (All versions)
Selecting "Geocentric coordinates", you will see the lunar
globe as if you were positioned on the line joining the center of the
Earth to the center of the Moon.
The software can instead use coordinates of your observing site to display
a real time lunar disk with computations including diurnal libration.
To do this, you have to de-activate "Geocentric coordinates" (uncheck
it) and input the latitude and longitude of your observing
site.
Input also the time shift from GMT including eventual "summer time" in the "Time zone" field.
"Date / Hour" frame (All versions)
The "Date / Hour" frame is used to precise the hour and the time zone to use.
Filling the box "Use computer hour and time zone" so that VMA use the computer internal clock as a reference.
If you don't fill the box, you can specify your own time zone with the case displayed.
"Language" scrolling list (All versions)
"Languages" scrolling list allows you to choose language used by the program and database. In this version, only French and English are available. You can also download from AVL / VMA Internet site, translations of words used in the menus. Translation pages indicate if database translations are also available.
"Databases" THUMBNAIL ("Pro" version)

"Databases" boxes ("Expert" and "Pro" versions)
"Databases" boxes allow you to choose the databases
used together by the software. Check only the one useful if your computer
is not too powerful.
When all databases are selected, VMA has more than 9200 entries to manage.
Christian Legrand has presently realized 5databases completally or partially completed :
- Named formations of Nearside (About 1100 entries)
- Satellitic craters of Nearside (About 5300 entries)
- Named formations of Farside (About 650 entries)
- Satellitic craters of Farside (About 1200 entries)
- Historical sites on the two faces (About 50 entries)
The database "Named formations of Farside" only appeared in the "Expert" version. The database "Satellitic craters of Farside" only appeared in the "Pro" version. Other databases are currently prepared and will be added in new coming versions.
"Display" THUMBNAIL (All versions)

Display boxes (All versions)
When clicking the "Show the phase" box, a penumbra zone is painted on the lunar globe. Its limit follows the terminator for the date and hour set by the user (See "Ephemerisis thumbnail"). You can set the penumbra properties representation (See "Setup thumbnail").
When clicking the "Show the libration" box, the lunar globe turns slightly so that it shows the effects of the global libration for the date and hour set by the user (See "Ephemerisis thumbnail"). You can set the penumbra properties representation (See "Setup thumbnail").
The libration display takes account of the latitude libration due to the Moon orbit inclination and of the longitude libration due to the Moon variable speed on its elliptical orbit. More, if you choose to input your observing site coordinates (See "Observatory coordinates")., the Moon globe will takes account also of the diurnal libration.
Colors (All versions)
Clicking on the small colored squares allows you to choose colors
indicating point and formation name label displayed on map.
Labels and marks (All versions)
Activating the corresponding boxes will make you display a point
showing the chosen formation and / or its official name
When clicking on the "Mark the point of maximum libration" box, an arrow is displayed on the lunar limb where libration effects are maximum.
Activating the corresponding boxes, you display the point (mark) showing the chosen formation, its official name, and the names of the other principal formations visible on the map.
You can choose to center or to place on the right of the formation when using or not the "Center label on formation" box.
The two sliders "Label size" and "Label density" can be used to setup name size and the number of names displayed. You will certainly have several tests to determine the best compromise. These two sliders are also use to setup map printing because the printed map is exact clone of the map displayed in the screen window.
"Textures" THUMBNAIL (All versions)

"Texture interpolation" box (All versions)
The activation of the "Texture interpolation" box improves textures display, specially in the libration zones.
"Near Side texture definition" frame (All versions)
Clicking on one of the boxes ("Full", "Half"
or "Quarter"), you can choose the texture resolution
of the map. The more quality, the more slower display. You can choose
according to your computer power.
"Far side texture definition" frame" ("Expert" and "Pro" versions)
In these versions, you can choose a less detailed "Far Side texture
resolution" if you want because it's not observable from Earth
or if your computer is a little slow.
"Texture choice" frame (All versions)
The "Texture choice" boxes allow you to choose the high definition texture to apply on the Moon globe. Two textures are available :
- "Clementine Aerographe" (USGS aerograph drawing realized
from Clementine probe pictures with a uniform shadow, by David Seal from
JPL and his team). In this "Expert" version, maximal resolution
"Full" is that of the Moon surface seen in a 120 mm (5")
instrument.
- "Clementine Photographic" (Mosaïc of Clementine
probe pictures realized by professor Mark S. Robinson, and his team of
"Northwestern University", copyright USGS / Astrogeology). In
this "Pro" version, this texture has a 500 m resolution.
It's the most precise presently available.
"Overlays" THUMBNAIL ("Pro" version)

VMA "Pro" version includes the ability to apply over the choosen texture an overlay which transparency can be setup so that texture continues to be seen through the overlay. These overlays are tansposition of scientific datas coming from the "Clementine" and "Lunar Prospector" missions, but they are also colors and geological full globe maps. This allows you to see, for each formation, its relation to available scientific datas.
"Show overlay" Box
If you fill the "Show overlay" box, you display the overlay choosen with the scrolling list below over the choosen texture.
"Overlays" Scrolling list

If you activate the scrolling list, you can choose in the list the overlay that you need. Here are the list of the overlays presently involved in VMA. We will add on our site new overlays to download as soon as they will be available. You'll find :
- textures overlays
- colors overlays
- a geological overlay
- topographical overlays
- elements concentration overlays
- Neutrons emissions overlays
Overlays presentation
"Natural colors" overlay

This overlay tries to show the Moon globe natural color. It's extracted
from a color mosaic realized with Clementine filtered pictures. There
is no caption since it's only a color.
"Enhanced colors" overlay

This overlay has been obtained while pushing to maximum color contrast enhancement in the three primal spectral colors. There is no caption since it's only a color. It shows subtile colors variations between highlands and mare surface and also shows different lavas flows in these marias.
Cette couche a été obtenue en augmentant au maximum le contraste en les trois couleurs spectrales. Il n' y a pas de légende spécifique puisqu'il s'agit d'un simple traitement d'image. Elle fait apparaître de subtiles répartitions dans les zones rocheuses et notamment les différents écoulements de lave dans les mers.
"Geological" overlay

This overlay has been realized with datas available on the USGS "Astrogeology / Webgis" and gathers several different Moon geological maps. Because each of the composing map has its own caption, the global caption, difficult to conceive, is not available presently.
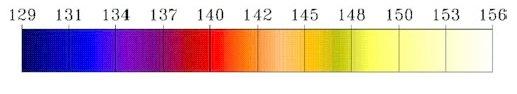
"Altitude" overlay


The captions are in feet. The left column is based on a linear scale for color spectra, while the right one is based on a linear scale for altitudes.
This overlay is conceived with altimetric datas recorded by Clementine probe and compiled by Maria T. Zuber and her LPI team. The overlay allows you to locate relative altitudes. It has been used to confirm the existence of the "South Pole / Atkein" impact basin in the Southern part of the Farside.
"Crust thickness" overlay


This overlay is conceived with orbital variations datas recorded by Clementine probe and compiled by Maria T. Zuber and her LPI team. The overlay allows you to visualize the lunar crust thickness under the formations. It will confirm you that this one is the lowest under the marias and the thickest on the Moon Farside.
"Bouger Gravity" overlay


This overlay is conceived with gravimetric datas recorded by Clementine probe and compiled by Maria T. Zuber and her LPI team. They have been completed with Dr Alan Binder and his team results from Lunar Prospector probe.overlay allows you to visualize gravitic anomalies under the formations. The unit is milligals. The biggest anomalies are under the marias showing the famous "mascons" presence. These datas are corrected with the Bouger method taking account of the soil density in the measurement site.
"Free Air Gravity" overlay


This overlay is conceived with gravimetric datas recorded by Clementine probe and compiled by Maria T. Zuber and her LPI team. They have been completed with Dr Alan Binder and his team results from Lunar Prospector probe.overlay allows you to visualize gravitic anomalies under the formations. The unit is milligals. The biggest anomalies are under the marias showing the famous "mascons" presence. These datas are corrected with the "Free air" method taking account of the altitude above the measurement site.
"Geoid anomalies" overlay

This overlay is conceived with graviimetric datas recorded by Clementine probe and compiled by Maria T. Zuber and her LPI team. They have been completed with Dr Alan Binder and his team results from Lunar Prospector probe.overlay allows you to visualize Moon globe shape anomalies which is not perfectly spherical. It whows that the Farside is less round than the Nearside.
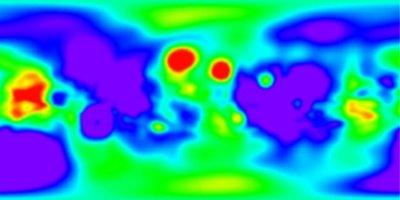
"Hydrogen" overlay

This overlay is conceived with Dr Alan Binder and his team results from Lunar Prospector probe. This overlay allows you to visualize hydrogen repartition on the surface. There is no caption available presently, but red is for high hydrogen concentrations and blue for the lowest.
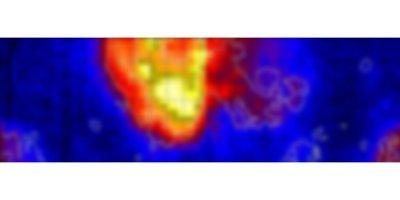
"Iron" overlay


This overlay is conceived with Dr Alan Binder and his team results from Lunar Prospector probe. This overlay allows you to visualize iron repartition on the surface. Immediatly, you can see that Nearside marias are rich with iron.
"Potassium" overlay

This overlay is conceived with Dr Alan Binder and his team results from Lunar Prospector probe. This overlay allows you to visualize potassium repartition on the surface. The measurement unit is based on detection counts. Immediatly, you can see that Nearside marias are rich with this element.
"Thorium" overlay

This overlay is conceived with Dr Alan Binder and his team results from Lunar Prospector probe. This overlay allows you to visualize potassium repartition on the surface. No caption is available presently, but red is for high hydrogen concentrations and blue for the lowest.Immediatly, you can see that Nearside marias are also rich with this element.
"Neutrons epithermal" overlay

This overlay is conceived with Dr Alan Binder and his team results from Lunar Prospector probe. This overlay allows you to visualize number of detected "epithermal" neutrons on the surface. The measurement unit is based on detection counts. Immediatly, you can see that Nearside marias are powerful emiters.
"Neutrons broadband" overlay

This overlay is conceived with Dr Alan Binder and his team results from Lunar Prospector probe. This overlay allows you to visualize number of detected "broadband" neutrons on the surface. The measurement unit is based on detection counts. Immediatly, you can see that Nearside marias are powerful emiters.
"Neutrons fast" overlay


This overlay is conceived with Dr Alan Binder and his team results from Lunar Prospector probe. This overlay allows you to visualize number of detected "fast" neutrons on the surface. The measurement unit is based on detection counts. Immediatly, you can see that Nearside marias are also powerful neutrons emiters.
"Transparency" cursor

This cursor allows you to choose the transparency degree of the overlay applied above the texture. It doesn't operate on the texture. When the cursor is on the right, the overlay ialmost invisible. On left, the underlaying texture is almost invisible. Choose what degree you would apply to be able to see all the details together. (Example shown without underlaying texture).
![]() < Non
transparent overlay
< Non
transparent overlay ![]() Transparent overlay
Transparent overlay
"Pictures" THUMBNAIL (All versions)

This thumbnail is used to sort the available pictures in the library
because their number will increase constantly, and the pictures display
setup.
Pictures windows number (All versions)
When clicking on the up and down arrows of the "Number of images
windows" box, you can choose the maximum number of displayed
pictures (10 maximum !). Optimum seems 5. You can display several pictures
of the same formation to see all the details, or the pictures of several
formations to compare them.
Pictures directories list (All versions)
You can edit the list of the "picture directories". In addition to the "LOPAM", "Clementine", "Probes", "Apollo", "CLA" and "My images"downloadable pictures, you can create one or more new directories to put in your own webcam or CCD pictures, or pictures coming from other sources and legally acquired.
"Eyepieces" THUMBNAIL (All versions)
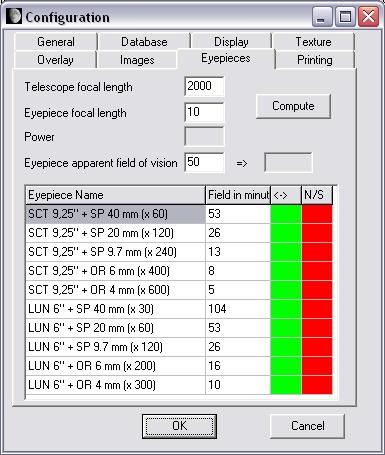
This thumbnail is used to setup parameters of your own eyepieces so thet,
you could display the real Moon aspect when observed in your instrument
with "Eyepiece" context menu function ("LUN"
is for "LUNETTE" = "REFRACTOR" in french).
Eyepieces list (All versions)
You can enter directly your eyepieces parameters in list fields if you
know them, as shown by the exemple which can be erased. "Name
of the eyepiece" is in the left column and the "apparent
field" in arc minutes in the right column. You can enter up to
10 eyepieces. It's better to enter them in the increasing magnification
way.
Eyepieces parameters computation (All versions)
Eyepieces parameters can be computed with the help of our calculator. First enter the "Instrument focal length". Then enter the "Eyepiece focal length". Then enter the "Apparent eyepiece field of view" in the third field. This field is that indicated in eyepieces advertisements. For example, Plossl eyepieces apparent field is about 50° and Ultra Wide Angle eyepiece is 82°.
Push the "Compute" button. In the "Real eyepiece field " frame, the area diameter is displayed in arc minutes. In the "Eyepiece magnification" frame, the magnification of the choosen eyepiece is indicated. After that, you have just to copy these two values in the two colums of the lower table.
You can also input directly the orientation view effects according to your instrument type by clicking in the boxes of the "<->" (Right - left inversion) and "N/S" (North / South inversion). If the rectangle is green, so the effect is activated. If it's red, so the effect is not activated. For example : if you use a Schmidt-Cassegrain or a refractor, the "<->" rectangle of the eyepiece must be green, but the "N/S" must be red. For a Newtonian telescope, the "<->" rectangle must be green and the "N/S" must be green too.
"Printing" THUMBNAIL (All versions)

This thumbnail is used to setup map printing parameters.
"Setup" button (All versions)
This button shows the standard Windows printing setup window.
Printing format (All versions)
This area is used to choose printing margins width and change the
Description text width.
Printed documents (All versions)
These boxes are used to select the documents that will be printed.
The printed map is that of the last window map. Topographic maps are black and white and geologic map are colored with color names in both types. Maybe you will have to change the Description text width to better see printed names.
"Ephemeris" text contains orbital, phase and libration information according to the last date and hour selected in the "Ephemeris" window.
"Description" text contains the information page of the last chosen formation on the map.
"Save map" frame (All versions)
Displayed map can be printed on paper with white background around the lunar disk to speed up printing and save ink!
"Help" MENU (All versions)

This menu brings up help tools to aid using the atlas.
"Help" choice (All versions)
This choice displays the present manual in an independent window.
"Glossary" choice (All versions)
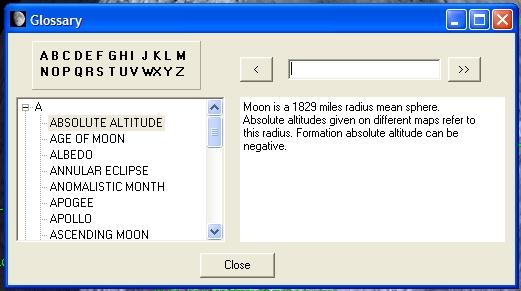
This choice gives access to a glossary containing more than 100 words and expressions linked to the Moon and its observation.
The glossary is also in an independent window which is divided in three distinct parts :
Upper part contains alphabet letters. Clicking on one of them gives access to the words beginning with this selected letter.
Left lower part is a tree of letters and associated words.
Right lower part contains an explanation of the selected word or expression.
"Encyclopedia" choice ("Pro" version)
This choice shows you a page with main dimensions of Moon globe and orbit.
"About" choice (All versions)
This choice shows the version of the program, and indicates how Christian Legrand and Patrick Chevalley divides their work in the creation and development of this atlas.
LABELS BUTTON ("Pro version)
This button allows you to access the color choice window for map labels. Its use helps a lot to adapt quickly the labels colours to the map hues context, specially with scientific overlays use.
ZOOM CURSOR (All versions)
Sliding this cursor from left to right increase zoom magnifying power of the map (See "Map window").
If cursor is on left, lunar globe is entirely visible. Moving it to the
right increases zoom power (zooms in).
Depending on the resolution textures chosen in the settings (See "Settings thumbnail"), zoom will not show new details and map display can become fuzzy.
Display of labels and marks is a function of zoom factor and of labels density (See "labels and marks").
"1:1" BUTTON (All versions)
Clicking on this button returns the map to the whole lunar
globe display in the "Map window".
"Center" BUTTON (All versions)
Clicking on this button will make the lunar globe center displayed on the center of your screen. It also centers the formation you have selected.
"North / South " BUTTON ("Pro" version)
If you click on this button, you immediatly invert the North - South in the "Map" window. It must be used with the "East - West" button below to change from naked eye view to Newtonian view.
"East / West " BUTTON ("Pro" version)
If you click on this button, you immediatly invert the East - West in the "Map" window. It must be used to change from naked eye view to refractor or catadioptric telescope view.
"Full globe" button ("Expert" and "Pro" versions)

When clicking on this button, you access to the most powerful function of VMA "Expert" version. If not down, the map window shows you the Near Side visible from the Earth with phase and libration applied if you checked the boxes in the "Display" thumbnail of the "Configuration" menu. But if you click down on this button, you go to "Full globe" mode and the map window displays a complete globe in three dimensions that you will be able to observe on all its faces.
"Libration" BUTTON ("Pro" version)
If you click on this button, you display or remove the libration effect on the Moon globe of the "Map" window.
"Phase" BUTTON ("Pro" version)
If you click on this button, you display or remove the phase display on the Moon globe of the "Map" window.
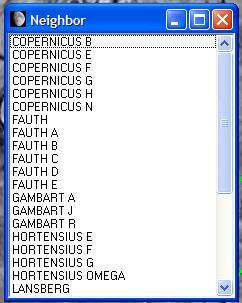
"Neighbor" BUTTON (All versions)
When clicking on this button, a new picture that contains the names of the formations in the neighborhood of the selected formation. You can click on one of them to go directly there.
"Picture" BUTTON (All versions)
If the selected formation doesn't have any pictures in the installed pictures libraries, the "Picture" button is not activated.
When you click on the activated button, you can obtain two different results :
1) There is only one picture of the selected formation in the LOPAM directory and this one is automatically displayed.
2) Several pictures are available for the selected formation and a list appears in an independent window. Click on that you want to display and it will appear in an independant window. You can open a number of pictures windows which is choosen in the "Pictures" of the "Configuration" menu.

The pictures library (All versions)
The pictures library is modular, so you can add a number of sources. You can download for this version picture files coming from two various sources. These files have obtained the necessary authorizations.
"LUNAR ORBITER PHOTOGRAPHIC ATLAS OF THE MOON" PICTURES

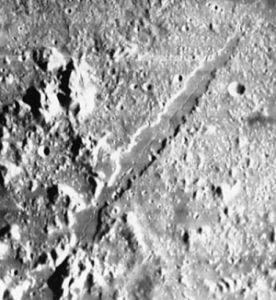
"Aristillus" and "Vallis Alpes"
VMA picture library contains in this version more than 1000 formation
pictures. These pictures have been extracted from the electronic version
of the "Lunar Orbiter Photographic Atlas of the Moon" (LOPAM) realized
by Jeff Gillis and his team at Lunar and Planetary Institute.
This remarkable atlas can be consulted on the site
http://www.lpi.usra.edu/research/lunar_orbiter/
Christian Legrand has extracted from each of the more than 640 LOPAM
photos, pictures of each named formation. He compiled about 3000 pictures.
Then, he chose the best one for each formation.
For some formations, which were spread on several photos, it was
necessary to cut and join several peaces. Some others need a new orientation.
All these pictures were then compressed so that small size for downloading
that doesn't alter quality.
Despite of this important work, about 150 formations haven't been recovered in the LOPAM photos because Lunar Orbiter 4 didn't photography the entire visible face.
These pictures are under "Lunar and Planetary Institute" copyright and cannot be used outside VMA.
LOPAM pictures are in the "LOPAM" sub-directory.
APOLLO MISSIONS PICTURES

With the goal to provide the most complete image of each lunar formation, Christian Legrand has also selected in the Apollo missions pictures more than 400 pictures related to more than 300 different formations.
These pictures are provided under the general copyright of the "National Air and Space Administration" (NASA) which own reproduction rights ( http://www.nasa.gov ) and they can't be used outside of the atlas.
Picture name indicates the formation name and the Apollo mission that took the picture when it's known : so COPERNICUS_A12.JPG is the name of a picture of Copernicus taken during Apollo 12 mission.
APOLLO pictures are in the "Apollo" sub-directory.
LUNAR PROBES PICTURES


Soviet Luna 17 pictured by mobile robot Lunakhod 1 (Left) and Tycho crater walls panorama taken by american probe Surveyor 7 (Right).
Many other automatic probes than Lunar Orbiter 4 have measured and photographed the Moon. These are american Ranger, Lunar Orbiter 1,2,3,5 and Surveyor. In the historical "Moon race" context, ex USSR has also launched a great number of Luna probes.
This picture library realized by Christian Legrand contains about 120 pictures taken by these probes. Found on the Web, these pictures are provided under the general copyright of the "National Air and Space Administration" (NASA) which own reproduction rights ( http://www.nasa.gov ) and they can't be used outside of the atlas. Soviet probes pictures have no identified copyright owners.
Picture name indicates the formation name and the probe or Apollo mission
that took the picture when it's known : The following code is used associated
with XX as the mission number :
- AXX : Apollo
- LOXX : Lunar Orbiter
- LUXX : Luna
- RAXX : Ranger
- SUXX : Surveyor
For example, LUNA 9_LU9.jpg is a picture of Luna 9 site taken by Luna 9 probe itself.
These pictures are provided under the general copyright of the "National Air and Space Administration" (NASA) which own reproduction rights ( http://www.nasa.gov ) and they can't be used outside of the atlas.
Probes pictures are in the "Probes" sub-directory.
CLEMENTINE PROBE PICTURES


Arzachel crater picture taken by Clementine (Left) compared to that of LOPAM (Right).
The other great source of lunar formations pictures is the american Clementine mission. This small probe has mapped the lunar surface with à 100 to 200 m per pixel.
Christian Legrand works on the general files and extracts pictures of each formation.
Clementine pictures are complementary to those of LOPAM. If their resolution and general quality are better, they have a big defect for terrestriel observers. They were taken with Meridian passing Sun, with the most vertical possible lighting that erases shadows and gives the formation albedo.
For formations situated in a + 45 ° North and - 45 ° South, Pictures show first the albedo. Compare for example with Bessarion LOPAM and Clementine pictures to see the difference.
For formations above these latitudes, shadows reappeared and many pictures are better than LOPAM. Compare with Anaxagoras for example.
Connect periodically to our site to discover the new additions.
These pictures are provided under the general copyright of the "National Air and Space Administration" (NASA) which own reproduction rights ( http://www.nasa.gov ) and they can't be used outside of the atlas.
Clementine pictures are in the "Clementine" sub-directory.
CONSOLIDATED LUNAR ATLAS PICTURES
The best ever published lunar atlas for the lunar observer is the "Consolidated Lunar Atlas " by Gerard Kuiper and al.
It copiles best Moon pictures taken from Earth by some great observatories as Catalina and Pic du Midi. Resolution of some pictures are about 1 km. Only since little time, amateurs equiped with webcams and large telescope begin to have better results than those ones.
This atlas has an unvaluable value because, as "Georges Viscardy's Photographic Atlas", it shows the formations under sevearl sun lightings and at the Full Moon.
For eample, here are the pictures extracted for Archimedes :

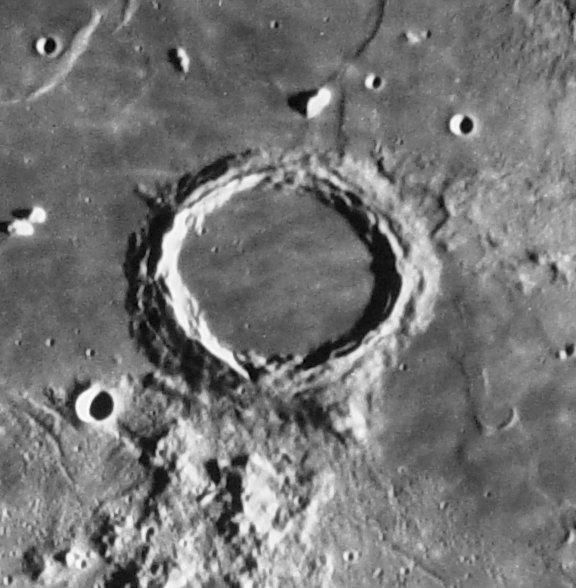


These pictures allows you to see the aspects of a given formation related to the observing day. This library is presently not complete. It contains more than 2000 pictures and will be updated regularly. Priority is given to CLA pictures above Clementine pictures because they are more useful for terestrial observers. And our "Clementine 500 m resolution" texture replaces them momentarily. Check regularly our Web site to see if CLA library updates are available.
These pictures are under "Lunar and Planetary Institute" copyright and cannot be used outside VMA.
This fabulous work is visible on the site :
The CLA pictures are in the "CLA" sub-file.
LUNAR ASTRONAUTICAL CHARTS AND LUNAR MAPS PICTURES
The best drawn Moon maps ever published are the "Lunar Astronautical Charts" and the "Lunar Maps". Their scale is 1 / 1 000 000. Most of them include altimetric levels curves allowing to determine heights or depths of formations.

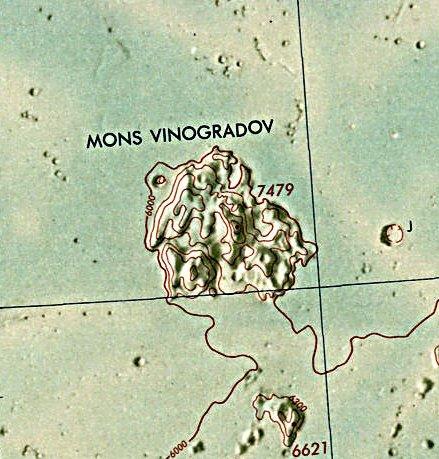

Christian Legrand has extracted from LAC / LM more than 800 formations pictures of the Nearside. Because of their precision and their colors, these pictures have not been compresses. This library is then heavy to download.
These pictures are under "Lunar and Planetary Institute" copyright and cannot be used outside VMA.
This fabulous work is visible on the site :
The Lunar Astronautical Charts and the Lunar Maps pictures are in the "LAC / LM" sub-file.
All this unique set of pictures librairies provides you numerous views of formations for comparing or studying them.
The pictures windows (All versions)

"Pictures" windows are independent and superimpose above main window. The title bar indicates the name of the displayed formation and the zoom factor applied to the picture. This one is "1:1" when opening first unless the picture is too big. A special area shows you the scrolling copyright of the picture. "Pictures" windows has three buttons
"Zoom +" BUTTON (All versions)
"Zoom +" button allows you to magnify the picture.
"Zoom -" BUTTON (All versions)
"Zoom -" button allows you to reduce picture magnification.
"Close" BUTTON (All versions)
"Close" button allows you to close the "Picture" window. It sends you to the choice of a new formation.
"2nd Window" BUTTON ("Pro" version)
If you click on this button, you open a new window of VMA that is over the first. This new window has the same properties as the main window. You obtain the "map" window, the "configuration" menu, the thumbnails and the buttons bar.
This new window opens with the same lunar area as the first. So, you can easily compare the two windows and you can apply in this second window textures and overlays different from those of the first window.
Screen capture showing VMA main window with "geological" overlay and second window with "iron" overlay.
Beware ! This new function needs a powerful computer to be exploited with all its possibilities (If possible, processor frequency above 2 GHz, 512 Mb RAM and a graphic card supporting OpenGL with 64 Mb video RAM)
"Map" window is on the left of general window. It shows
Moon "aerographe" or "geological" maps
according to the option selected(See "Map display
"). This window can't be removed and is not independently sizable. Slide
bars appear according to the applied zoom factor (See "Zoom
cursor").
THE MAP (All versions)
It's oriented in the same direction as Moon seen with naked eye or binoculars.
You can turn the map around its center to copy the eyepiece vision in
a Newtonian. You can display the map as in a mirror to see it as in a
refractor or a Schmidt-Cassegrain instrument (See "Tools"
thumbnail).
"Near Side" map with inversion "<->" (All versions)


Copernicus and Eratosthenes
If the "Libration" option (See
"Configuration menu") is choosen, center of the map is not
absolutely the center of the presented drawing because of libration. "Expert"
version texture has been configured by Patrick Chevalley for an optimal
display, specially for libration zones. The "aerograph"
map in the window is provided by David Seals and his team from
"Jet propulsion Laboratory" of NASA. it shows only the Near Side
and corresponds to the details visible in a 120 mm (5") instrument
applied on a 3D sphere with move limited to libration and managed by Open
GL.
"Full globe" map ("Expert" and "Pro" versions)

It permits to view a complete lunar globe and to study the Far Side invisible from the Earth (On the above screen capture, you can remark Mare Orientale). It's always the same "David Seals" texture presenting details visible in a 120 mm (5") instrument applied on a 3D sphere, but in that case with no limited move.
If the options "Display libration" and " Display phase " (See "Configuration menu ") are checked, the lighting of the lunar globe is as the real one, for the date and hour choosen in the " Ephemerisis" thumbnail.
Map move (All versions)
As a zoom factor is applied to map, you will be able to move into it.
Move mode is different between the "Near Side" mode and
the "Full Moon" mode. In each case, You can use classic
"Windows" Slide bars on the right side and below the window.
In the "Near Side" mode, you can also "grab" the map
in left clicking on it and keeping left button clicked while moving the
mouse.
In the "Full Moon" mode, you can also "grab" the globe with a mouse left click and while keeping left button click, you can turn the globe in the East or West direction when moving the mouse.
Mouse right click (All versions)
A right click on the mouse and a context menu appear with several choices.
Information : Sends you to the information database window.
Picture : Displays the pictures list or the LOPAM picture of the selected formation.
Notes : Send you to the "Notes" thumbnail
Neighbour : Displays in a new window the formations list in the neighbourhood of the selected formation.
Center : Centers the map on the selected formation.
Zoom : Can setup directly the zoom factor to 1/1, 1/2 or 1/4.
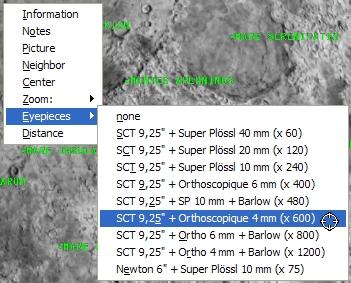
Eyepieces : Allows you to choose the used eyepiece and have the
exact view in the associated instrument. A black mask with a round centered
hole appears on the "Map" window. To cancel, just click
the "None" option.
Distance : Activate the mode "Distance measurement" (Voir "Distance measurement")
Satellisation : Activated only in the "Full globe" mode. Activate an automatic rotation to "scroll" the globe as in the case of a simulated "satellisation". Indicated speeds are in "degree of longitude per second", or the manual rotation with "Direction".

THE "INFORMATION" THUMBNAIL (All versions)

SEARCH SCROLLING LIST (All versions)

You can enter in this scrolling list some letters of the name of the
formation you want to find. It will accept "wildcards", so "*tri"
will include in the scrolling list "Triesnecker" and "Rimae Triesnecker",
for example.
"Find" BUTTON (All versions)
Clicking on this button will display the formation selected in the
"Search" list.
"Find next" BUTTON (All versions)
Clicking on this button will display localization and data of the next
formation in the "Search" scrolling list.
"Outline" FRAME (All versions)
![]()
In this frame, outline of the formation selected within your search and whose description is in the "Database window" is displayed (See "Outline" for more information on the display)
Here is a semi-graphic field presenting the formation profile. This information is only provided when height is known.
Profile has not be constructed for some formations types :
- Sea
- Lake
- Gulf
- Marsh
- Ocean
- Probe
- Human mission
The profile is generated according to the following description :
Crater outline :
Crater is presented so :
A________________A
< n characters>
"A" characters show the slope height. The number of "_" characters shows the crater width with the same scale as height.
Because the "A" character is twice high than wide on an html screen,
in the above example, the width / height crater ratio is 1/8.
The central mountain of crater has not been represented because their height has often not been found.
Don't forget that each formation has its own profile. You can't compare two craters dimensions using their profile representation.
A__________A Profile of (Length =20 km & height = 4000 m)
A__________A Profile of (Length = 5 km & height = 1000 m)
On screen, these two profiles are identical, but as you
can see, dimensions are different.
Relief outline :
For mountains, mountains ranges, wrinkle ridges or domes, an other viewing mode is selected :
___A___
"A" character shows the formation maximum height. The number of "_" characters shows the formation width with the same scale as height.
Rille outline :
For rilles, rilles system and valleys, profile is shown like this :
___ ___
V
"V" character shows the formation maximum depth. The number of "_" characters shows the formation width with the same scale as depth.
THE DATABASE WINDOW (All versions)

The Database window is organized to display formation information extracted from the database. It has a slide bar on the right if not all the data can be displayed in the window.
The database is the most important detailed database existing today. It's divided in several sections :
Nearside named formations : The formations of the Nearside which have a specific name (eg : Clavius, Rima Hyginus, Montes Alpes...). About 1100 entries.
Nearside indexed craters : The formations of the Nearside which don't have a specific name (eg : Clavius D, Hyginus A, Plato B...). About 5300 entries.
Farside named formations : The formations of the Farside which have a specific name (eg : Tsiolkovsky, Mare Moscoviense...). About 650 entries.
Farside indexed craters : The formations of the Farside which don't have a specific name (eg : Tsiolkosky D, Schrodinger A...). About 4100 entries.
Historical sites : The sites of all voluntary or accidental human impacts or landing sites (eg : Apollo 15 Base, Ranger 7, Luna 9, Apollo 17 S IV B...). About 50 entries.
For each formation, available information is :
- the formation name origin.
- the main lunar atlases for amateur astronomers page where to find
the formation.
- the formation location on the lunar disc.
- the formation description.
- various useful information for serious observing.
These databases have been translated from French by a French man. Please forgive the rather poor English that has been used and language mistakes that you can find. You can report them to Christian Legrand. They will be corrected as soon as possible.
Warning : In such detailed work, the data will certainly contain some mistakes - mainly input mistakes. You can also report them to Christian Legrand so that he can correct the database.
The authors thank you in advance for your cooperation.
Informations of the VMA databases are copyrighted "(c) Christian Legrand" and can't be used outside of the software. For any other use, please contact the author.
Database detailed information presentation
OFFICIAL NAME :
This field presents the formation main name in Latin used officially
by the International Astronomical Union in capital letters. In the "Historical
sites" database, it's the name of the mission (eg : Apollo 15
Base, Ranger 7, Luna 9, Apollo 17 S IV B...)
FORMATION TYPE :
This field contains formation type according with tradition or International Astronomical Union, plus some specific additions :
- Cape
- Cliff
- Crater
- Craterlet
- Crater chain
- Dome
- Gulf
- Lake
- Marsh
- Mountain
- Mountains range
- Plain
- Probe
- Rille
- Rilles system
- Sea
- Tray
- Valley
- Walled plain
- Wrinkle ridge
- Wrinkle ridges system
The "Historical site" database contains specific types :
- Human mission / soft landing
- Inert equipment / voluntary impact
- Inert equipment / unvoluntary impact
- Probe / voluntary impact
- Probe / unvoluntary impact
- Probe / soft landing
FORMATION PERIOD :
Formation age is indicated according to the lunar period of birth. The 6 generally admitted periods in present literature are :
Pre-Nectarian : (-4550 MY to -3920 MY)
Nectarian : (-3920 MY to -3850 MY)
Lower Imbrian : (-3850 MY to -3800 MY)
Upper Imbrian : (-3800 MY to -3200 MY)
Eratosthenian : (-3200 MY to -1100 MY)
Copernician : (-1100 MY to present days)
MY = Millions years
Indicated age has been extracted from remarkable book of Don E. Wilhelms and his team : "The geologic history of the Moon", USGS publication n° 1348 of 1981. Maps and texts of this book have provided about half of the indicated ages. Written after Apollo missions, this book contains most of this period's discoveries.
In this "bible", some craters are ideal examples of each of the 6 above periods. They have been indicated in the database as "Typical".
The other half of the age data has been obtained from a geological map of the Moon, also realized by Don E. Wilhelms and his team in 1971. Formation age is less precise on this map. Indicated ages have a "?" at the end to show the lesser precision. More, this map has only 4 periods :
Pre-Imbrian : (-4550 MY to -3850 MY) that contains Pre-Nectarian and
Nectarian.
Imbrian : (-3850 MY to -3200 MY) that contains Lower and Upper Imbrian.
Eratosthenian : (-3200 MY to -1100 MY)
Copernician : (-1100 MY to present days)
For some formations, it was not possible to find information about the birth period. Then, it's indicated "Birth period not found".
In the "Historical site" database, the launch date is indicated in this field.
The four following fields contain data about formation dimensions.
These vary from different bibliographic sources. First indicated is data
provided by International Astronomical Union, then those coming from other
sources when they seem more accurate. Some of them have been also
directly measured on atlases or photographs when they were not found in
literature.
In the "Historical sites" database, these fields are
empty.
Length :
This first field indicates the formation length in miles. For craters,
length is very often equal to width because it's the mean diameter.
Width :
This first field indicates the formation width in miles. For craters,
length is very often equal to width because it's the mean diameter.
Height :
You find here relative altitudes, not absolute ones referring to the
mean lunar sphere. It gives the formation height when it's known.
For craters, it's the difference between the upper part of the internal slopes and the floor.
For other formations, it's the difference between the formation summit and surrounding land.
For mountains and mountain ranges, it's a mean height and higher summits height is generally detailed in description fields.
For rilles and scarps, it's the difference between surrounding lands
and the formation lower floor.
Ratio :
This data is only indicated for formations whose height is known. It's
very often given for craters where it means the diameter / height ratio.
DESCRIPTION :
This field is divided in four sections for the formation detailed description.
But this division is not really visible when consulting the
formation form on screen or printing it.
Cardinal points are reference to indicate where the different details are situated according to formation center. For a crater, reference point is the area center.
If observed with naked eye, on the Moon, North is up, South is down,
West is left and East is right.
North
North-West___________________North-East
Formation
center
South-West_____________________South-East
South
For example, a craterlet located on a crater wall down left will be described
as "Walls ridden by a craterlet at South-West".
Craters are the most numerous formations. Their description is well divided in four parts.
General description
First, information about shape, location and preservation of the formation.
External slopes description
Then, the external "slopes" are described. Generally, the comments are about their inclination. If radial valleys are present, slopes are described as "tormented". This part also indicates craters and craterlets situated on external slopes.
Internal walls description
The "walls" which are described are the internal ones. They link the upper rim of the slopes to the crater floor. The walls are described as "little high when the altitude difference is less than 2,000 m, "pretty high" between 2,000 and 3,000 m, "high" between 3,000 and 4,000 m and "very high" if more than 4,000 m. The indicated information is that which seem the most believable according to important variations in different bibliographical sources. This part also indicates craters and craterlets situated on internal slopes.
Crater floor
The crater "floor" is described as "flat" if no hills can be found to
"tormented" if it's very irregular. The non circular shape is
mentioned. If lava seems to have flooded the crater floor, it has been
indicated. This part also indicates craters and craterlets situated on
the floor.
Historical sites
In the "Historical sites" database, specific descriptions includes :
- Launch date and hour
- Astronauts names for a human mission
- Probe or spaceship description
- Mission main phases dates and hours
- Scientific results
Interest :
This field will help you to determine which formations to observe. It
gives you information on the formation interest. It has been defined by
the authors according to their own experience. Sure, you can disagree
with them.
Formations are indicated as :
- Low interest formation
- Pretty interesting formation
- Very interesting formation
- Exceptionally interesting formation
Lunar month day for evening observation :
This expression means "Day of lunar month permitting an evening observation of the formation". It has been observed that Eastern limb formations can only be well observed 2 days after New Moon.
The indicated day is the one for a null libration. It has been computed
from formation longitude. According of the real libration value, it can
be shifted by one day more or less.
Lunar month day for morning observation :
This expression means "Day of lunar month permitting an morning observation of the formation". It has been observed that Western limb formations can only be well observed 2 days before New Moon.
The indicated day is the one for a null libration. It has been computed
from formation longitude. According of the real libration value, it can
be shifted by one day more or less.
Useful instrument :
This field presents the smallest instrument needed to comfortably observe the formation. It has been computed from the formation width and from practical resolution power (PRP) of the instruments defined as the double of TRP. It is supposed to be obtained when using a magnification equal to instrument diameter in centimeters.
This data is provided for a Moon mean distance of 202,000 miles. An arc second is then about 1 mile on the Moon.
This data depends on other external criteria such as instrument quality, observer's eye health, seeing...).
- Naked eye (PRP = 10O miles)
- x10 binoculars (PRP = 20 miles)
- 2" refractor (PRP = 5 miles)
- 4" reflector (PRP = 2.5 miles)
- 6" reflector (PRP = 1.6 miles)
- 8" reflector (PRP = 1.2 miles)
- 10" reflector (PRP = 1 mile)
- 12" reflector (PRP = 0.8 mile)
POSITION :
Longitude :
You can find here the selenographic longitude of the formation with a
tenth of degree precision. This data is provided by International Astronomical
Union. Longitude is negative to the West of central meridian. About craters,
it's the center longitude. For lengthened or irregular formations, it's
an internal point the closest to central.
Latitude :
You can find here the selenographic latitude of the formation with a tenth of degree precision. This data is provided by International Astronomical Union. Latitude is negative to the South of lunar Equator. About craters, it's the center longitude. For lengthened or irregular formations, it's an internal point the closest to central.
Quadrant :
Information has been included to make easier the location of the formation on the lunar disk. The location system is that of the International Astronomical Union since 1988. When you look at the lunar disk with the naked eye, the North is up and the East is right.
This first field indicates the lunar quadrant where is situated the formation according to the "Lunar Quadrant Charts" by Arthur and Agnieray published by the University of Arizona :
- North-East
- South-East
- North-West
- South-East
Area :
This field indicates clearly the lunar region where can be found the
formation according to a more known one (sea, mountain or large crater)
or according to the position on the edge of the lunar disk (limb) or according
to the center of the lunar disk.
ATLAS :
This field contains pages, maps or picture of the main paper atlases presently available on which the selected formation is indicated.
Rükl :
In honor to its author for his contribution to Astronomy popularization,
we have mentioned the map number of the "Atlas of the Moon" by Antonin
Rükl on which is found the formation.
Viscardy :
Also in honor to its author for his contribution to Astronomy popularization,
we have also mentioned the page number of the "Photographic Atlas of the
Moon" by Georges Viscardy on which the formation is found with a text
on it, or on which a photograph shows the place where is situated the
formation.
For this last work, when the formation does not figure on at least
one photograph, there is no page indicated. Similarly, if the formation
appears on, at least, a photograph, but is not described in the text,
it is the page of the best photograph where it is normally visible that
is indicated.
Hatfield :
In honor to its author for his contribution to Astronomy popularization,
we have mentioned the map number of the "Hatfield Atlas of the Moon" republished
by Jeremy Cook on which the formation is found.
Westfall :
In honor to its author for his unique work, we have mentioned the maps numbers of the "Atlas of the Lunar Terminator" from Professor John E. Westfall on which the formation is found, because it's the only one that shows all librations variations.
Wood :
We mentioned Charles Wood's articles on numerous formations
edited in Sky and Telescope and the number of his "Lunar
100 list", with his courtesy.
LOPAM :
Adding to downloadable picture of the LOPAM, we have indicated numbers of "Lunar Orbiter Photographic Atlas of the Moon" pages on which you can find the selected formation. Just click on this link and go to the Internet site of Jeff Gillis of Lunar and Planetary Institute and you will admire the entire picture from which was extracted the picture.
Nevertheless, if you are not permanently connected to the Internet, another possibility is offered.
You can modify the "lopamidx.txt" file which is in the "Database" sub-directory of the "Virtualmoon" install directory with a text editor as "Windows notepad". After, you can access directly to the LOPAM pages copied on your hard drive or on a recorded CD.
In this file, you have just to indicate after "Local URL=" the path of your support where are stored your LOPAM pages, and the pictures type after "SUFFIX=". For example :
Local:URL=c:\Program files\Virtualmoon\LOPAM pages\SUFFIX=.jpg
can access to LOPAM pages stored in the sub-directory "LOPAM pages" of the install directory "Virtual moon" as ".jpg" files.
New example :
Local: URL=d:\ SUFFIX=.bmp
can access to LOPAM pages stored in the root of a CD placed in a CD reader called "d:" as ".bmp" files.
NAME ORIGIN :
Real name :
This field presents the real name of the person whose name has been given to the formation. When it also exists, a nickname is indicated between parentheses.
For other formations than craters, the official name is first translated
in English, and then you can find the real name of the person whose
name has been given to the formation.
Works :
This field indicates, for craters, the activities of the person whose
name has been given to the formation.
Here is the list of the"works" you can find in the database:
- Agronomist
- Alchemist
- Admiral
- Anthropologist
- Archaeologist
- Archbishop
- Architect
- Artist
- Astronaut
- Astronomer
- Astrophysicist
- Aviator
- Banker
- Biologist
- Botanist
- Calif
- Cartographer
- Chemist
- Clockwork
- Consul
- Cosmographer
- Egyptologist
- Engineer
- Engraver
- Explorer
- Geodesist
- Geographer
- Geologist
- Geometer
- Geophysicist
- God
- Hero
- Historian
- Humanistic
- Hydrographer
- Inventor
- Jurist
- King
- Manufacturer
- Mathematician
- Meteorologist
- Mineralogist
- Missionary
- Mythological fame
- Naturalist
- Navigator
- Oceanographer
- Optician
- Paleontologist
- Pharmacist
- Philologist
- Philosopher
- Physicist
- Physiologist
- Poet
- Political man
- Priest
- Printer
- Professor
- Scientist
- Sailor
- Saint
- Sismologist
- Sponsor
- Stateman
- Technician
- Theologian
- Writer
- Zoologist
Please note that some people have been credited with 2 or 3 works.
Nation :
This field indicates the nationality generally attributed to the person whose name has been given to the formation. It can be the birth nationality. You can also find nationalities no longer in existence.
Here is the list of nationalities present in the database:
- American
- Arabian
- Australian
- Austrian
- Babylonian
- Belgian
- British
- Byzantine
- Brazilian
- Canadian
- Carthaginian
- Castillan
- Chinese
- Cretian
- Dalmatian
- Danish
- Dutch
- Egyptian
- English
- Finnish
- French
- Greek
- German
- Hungarian
- Indian
- Irish
- Italian
- Japanese
- Jewish
- Macedonian
- Mexican
- Norwegian
- Persian
- Polish
- Portuguese
- Roman
- Russian
- Scottish
- Soviet
- South African
- Spanish
- Swedish
- Swiss
- Czech
- Venetian
Birth place :
This field indicates the birth place of the person whose name has been
given to the formation when it has been possible to find it. If not found,
it is indicated " ? ". Please note that for imaginary persons, there
is no birth place.
Birth year :
This field indicates the birth year of the person whose name has been
given to the formation if it has been possible to find it. If not found,
it is indicated " ? ". Please note that for imaginary persons, there is no
birth year.
Death place :
This field indicates the place of death for the person whose name has been given to the formation when it has been possible to find it. If not found, it is indicated " ? ". Please note that for imaginary persons, there is no place of death.
Death year :
This field indicates the year of death for the person whose name has
been given to the formation if it has been possible to find it. If not
found, it is indicated " ? ". Please note that for imaginary persons, there
is no year of death.
Prominent facts :
This field describes prominent facts during the life of the person whose name has been given to the formation if it has been possible to find it. If not found, it has been indicated " ?? " .
This information is adapted from information given by the International Astronomical Union, and additional data coming from various bibliographical sources.
Generally, you can find the discoveries, inventions and important works attributed to the person, as well as distinctions obtained during life (nominations, price. ..) with associated dates when they have been found.
Name author :
This field indicates, when it's known or supposed, the organization or
person name that has given the name to the formation. Also included in
this chapter is the year of nomination when it has been found. In this
paragraph, IAU means" International Astronomical Union ". You can find
mainly 3 origins:
- Hevelius
- Riccioli
- IAU
When the origin has not been found, the field contains (??). Additionally, some uncertain origins end with "?".
These name origins are purely indicative and are not to be held as rigorously exact because of numerous additions made during all periods to the lunar nomenclature.
In the "Historical sites" base, it's the country and the agency which conceived the mission that are indicated.
Name given by Langrenus:
This field indicates the name given by Michel Florent Van Langren on his Moon map in 1644. When the formation has not received a name, "Not named" is indicated.
Name given by Hevelius :
This field indicates the name given by Johannes Hevelius on his Moon map in 1647. When the formation has not received a name, "Not named" is indicated.
Name given by Riccioli :
This field indicates the name given by Riccioli on the Moon map drawn in 1651 by Francesco Grimaldi. When the formation has not received a name, "Not named" is indicated.
THE "EPHEMERIS" THUMBNAIL (All versions)
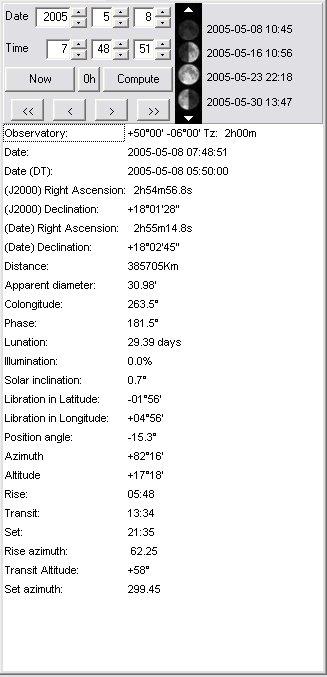
When you click on the "Ephemeris" thumbnail, the right frame window fills
with Moon sky and orbit position data: This position can be set entering
some parameters.
DATE AND HOUR INPUT (All versions)
Observation date and hour can be set with upper case, either clicking
and entering them directly or using the arrows. The "Compute"
button displays the map with the choosen date and hour.

The "Now" button can show directly the Moon aspect at the current time. Date and hour used are those of your operating system. Verify if it's on time. This setting is very useful when using the software "in the field".
The "Compute" button display the Moon as it looks like to the date and hour selected with the previous paragraph.
The "Oh" button shows you the Moon at 0 h on the date
selected with the previous paragraph.
"VIDEO RECORDER" BUTTONS (All versions)
"Video recorder" buttons are a powerful provision meant
for real Moon aspect changes. They are very useful when using Open gL
3D display with the "Phase" and "Lib ration" options activated.
">>" and "<<" buttons can increase or decrease date with
a one day rate. ">" and "<" buttons increase or decrease hour with
a one hour rate.
These buttons allow you to observe the phase and librations evolution during time. They can be used to detect best observing periods of formations which are near or inside the librations zones.
"PHASES CALENDAR" (All versions)

This is a tool to help you for preparing next observing sessions. This part of the frame shows you a Moon phases calendar. It contains the next four phases. But, with the white arrows, you can navigate in the list and retrieve old or future phases dates.
THE
"EPHEMERIS" WINDOW (All versions)
The right frame window contains the following information on Moon position
:
Moon right ascension
Moon declination
Distance :
Apparent diameter:
Phase angle
Lunation day
Illumination percentage
Solar inclination
Latitude libration value
Longitude libration value
Maximum libration position on limb
Moon rise hour
Moon meridian transit hour
Moon set hour
Moon rise azimuth
Moon set azimuth
The following informations are not displayed if you check the box "Geocentric
coordinates" in the "General" thumbnail of the
"Configuration" menu.
Moon rise hour
Moon meridian transit hour
Moon set hour
Moon rise azimuth
Moon set azimuth
THE "TERMINATOR" THUMBNAIL (All versions)

This option can list in the right frame window, a list of formations
visible along the terminator according to date selected in the "Ephemeris
thumbnail". And more, you can extract and sort these formations using
some choices.
"INTEREST" SCROLLING LIST (All versions)
You can set with the scrolling list "Interest" a filter for limiting
your choice. You can choose between :
- All the formations
- The pretty interesting formations
- The very interesting formations
- The exceptional formations (The best ones)
"INSTRUMENT" SCROLLING LIST (All versions)
A second filter can be set to limit the listed formations to those which are visible in a given instrument (See "Useful instruments "). You can choose this one in the scrolling list. "999" doesn't limit the list (No applied filter).
You can see that most of the formations can yet be observable in a 100
mm (4 ") instrument.
"SORT" MARKS (All versions)
These selections choose the presentation mode of the extracted formations list
- Name
Clicking this point sorts formations by alphabetical order
- Latitude
Clicking this point sorts formations by latitude from equator to North pole and then, from equator to South pole.
- Interest
Clicking this point sorts formations by interest.
- Instrument
Clicking this point sorts formations by instrument capability
THE "NOTES" THUMBNAIL (All versions)

It's in this thumbnail that you can input all your notes written during an observation of the selected formation. Each formation has its "notes sheet" waiting your commentaries. These are stored in a personal special dtabase.
The "Update" button is used to input the notes you have just written in the database. Don't forget to click it or your notes will be lost.
THE "SETTINGS" THUMBNAIL (All versions)

This thumbnail will allow you to choose the special settings for the display.
"PENUMBRA" CURSOR (All versions)
This cursor sets the transparence of the "night" part of the Moon globe when the box " when the "Show the phase" box in the "Display" thumbnail of the "Configuration" menu is activated. We think it's better to choose an intermediate setting to give an "Ashen Light" appearance to the rest of the globe. Cursor at left gives a night part completely black. But if you want to use VMA as an atlas, put the the cursor to right or uncheck the "Show the phase" box in the "Display" thumbnail of the "Configuration" menu
In the "Light" version, checking the "Hashed umbra" replaces the dark part by lines permetting to use lighter hardware configuration.
"DIFFUSE" CURSOR ("Basic", "Expert" and "Pro" versions)
This cursor sets the general quality of the map.
"DIRECT" CURSOR ("Basic", "Expert" and "Pro" versions)
This cursor manages the transition zone between light and shadow width.
At left, it's maximal but not too realist. Ce curseur sert à gérer
la largeur de la zone de transition entre la partie éclairé
et la partie nocturne de la face visible. Complètement à
gauche, cette largeur est minimale. A droite, la transition est maximale,
mais peu réaliste. Il vous est conseiller d'adopter un réglage
intermédiaire.
Beware ! As VMA uses a 2D texture applied on a 3D sphere by the mean
of Open GL, it doesn't generate the formations shadows on the terminator.
"RESOLUTION" CURSOR ("Basic", "Expert" and "Pro" versions)
This cursor manages the 3D sphere when textures is applied precision.
At left, it's not a sphere but a rough polyedra with visible flat faces.
Moving the cursor at right increases the faces number, but this needs
a more powerful computer.
An image number indicator (fps) shows you the performance of your configuration.
Don't go under 4 fps to keep a sufficiently speedy display when handling
the map.
But, going to a better spherical resolution also slightly increases the formations place precision on the map.
"OPEN GL INFO" BUTTON ("Basic", "Expert" and "Pro" versions)
This button displays a window giving informations on your graphic card. Use it to know what options are available on your compuuter and to check if it workw well.
"OPTIONS VALID AT NEXT STARTUP" FRAME ("Basic", "Expert" and "Pro" versions)
As indicated , changing one of the following options will be taken account only at next computer startup.
"Use double buffer" :
Normally, this option must be checked to avoid display flickering. Removing
it can nevertheless improve performances with some graphic cards types.
"Use stencil buffer" :
Try this option if some "waves" appear in some part of the map.
It can also improve performances with some graphic cards types, but be
inefficient with some others.
"Use textures for the libration zone" :
This option is usually checked to draw the libration zones formations
(longitude > 90°). You can cancel them for less graphical memory use.
this can improve considerably your computer performance with some 16 or
32 MB memory. Other options linked to performances are available in the
"Display" and "Textures" thumbnail of
the "Configuration" menu.
THE "TOOLS" THUMBNAIL (All versions)
"Tools" thumbnail in "Telescope" mode

"Normal mode / Distance measure" BUTTON (All versions)
This button changes cursor action mode on the map. It's a toggle button. Its caption changes to allow you to go back to the other mode.
"Normal mode"
When in normal mode, the cursor is like a round bull's eye and is used to select formations.
"Distance measure"
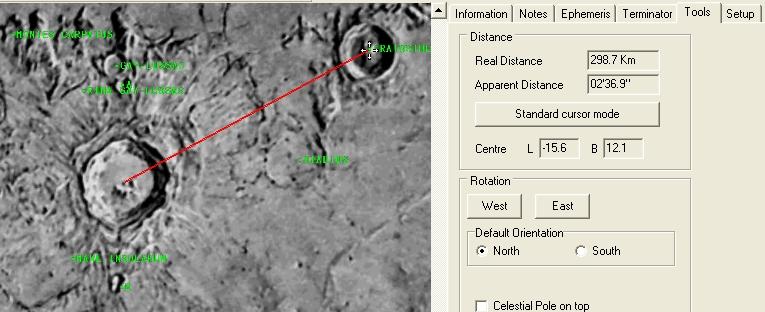
When in this second mode, the cursor changes its shape and is used for measuring distances between lunar formations or for measuring dimensions of a selected formation.
Put the cursor on the beginning of the distance to measure. Click with the left button and hold it down. Move the mouse. A color line originating at the first point appears. You just have to go to the end of the distance you want to measure by moving the mouse. Once there, release the mouse button. The line stays visible.
Up in the "Tools" panel, a box indicates the length of the drawn line in km and in arc minutes. Spherical shape of the Moon in included in the computing method. So, near the lunar limb, two perpendiculars lines with the same apparent length will indicate different dimensions.
You can turn the map so that it matches what you are observing through the eyepiece of a Newtonian telescope.

When clicking the "East" or "West" button, you rotate
the map display with a slight angle in the choosen direction.
"Mirror" BOX (All versions)
When you select this box and the "North" box together, the Moon map will show you what you will see in an instrument as a refractor or catadioptric reflector as Cassegrain, Schmidt-Cassegrain or Maksutov telescope.
"Telescope" Frame ("Expert" and "Pro" versions)
This frame allows you to setup your "Goto" mount.
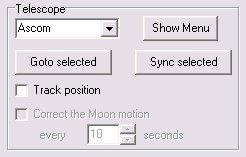
If you own a such computerized mount which accepts the ASCOM protocol, the Virtual Atlas of the Moon will track it directly on the Moon.
First of all be sure that you have installed the good ASCOM drivers on
your computer. If not, go on the internet to the site
to download them. Install them.
Connect your mount to your computer. Start your computer and the version of the software.
First initialize tour telscope as usually, then use the pad or a planetarium software to point the Moon.
Click on the "Show menu" button and launch the connection.
Begin centering a well known formation in the eyepiece fieeld and select it on the map. Push the "Sync selection" button for initializing telescope coordinates on this position.
It's also possible to make this operation on a star near the Moon with the planetarium program.
After, check the box "Track position" so that the map displays always the telescope position.
If your telescope can do automatic pointing, you can now click on a formation on the map, or choose it with the "Search" function of the "Information" thumbnail and then click on the "Goto selected" button
If you check the "Correct the Moon motion" box, you can choose the period correction with the choice box below.
"Orbit the Moon" Frame ("Expert" and "Pro" versions)

This frame can simulate the view you should have from a spaceship orbiting around the Moon.
Choose the automatic rotationspeed in the scrolling list.
"<" et ">" buttons allows you to choose the rotation direction.
" II " button stops the automatic rotation.
"East view", "Center" et "West view" buttons send you to the Moon Equator on the East or West limb or on the center of the Moon disk.
Names display is only effective when rotation is stopped.

Above : Copernicus rise simulation
THE STATUS BAR (All versions)
![]()
"COORDINATES" DISPLAYS (All versions)
Latitude and longitude of the pointer on the moon globe are displayed on the left side of the status bar. Don't mix them with your observing site coordinates
"DATE AND HOUR" DISPLAY (All versions)
The date and time in the status bar corresponds to the time selected in the "Ephemeris" tab. It should not be confused with the date and time of your system!!!
END OF MANUAL