Doppler imaging of stars disk
The spotted star HR1099
Presence of dark spots on star disk surface is a well know phenomena, here the Sun example:

Spots can be also detect on far star by using high resolution spectrography...
This page describes an attempt of a stellar disk Doppler imaging. It may be a first for amateurs. I used the spectrograph VHIRES-MO, which shows a spectral resolution of R = 50000, required for this type of observation. The spectrograph is coupled to a Celestron 11 telescope (D=0.28 m) by a 10 meters long, 50 microns diameter optical fiber. For a description of VHIRES-MO spectrograph, click here.
The target is the star HR 1099, a well know example of spotted object. HR 1099 (V711 Tau) is a V = 5.64 close double-lined spectroscopy binary, the brightest RS CVns class type, with a K1 IV primary and a G5 V secondary tidally locked in a 2.83774 days orbit. The K sub-giant primary also shows chromospheric activity (Halpa flare, ...).
Vogt & Penrod in 1983 (PASP, 95, 565, 1983) presented the first Doppler Image of HR 1099. Surface image of KI IV was obtenained from the spectroscopic deconvolved line profiles (spots seem confined on the subgiant primary). The origin of distorsions in line profiles induced by dark spot transit is illustraded by the next figure (from the original Vogt and Penrod paper):
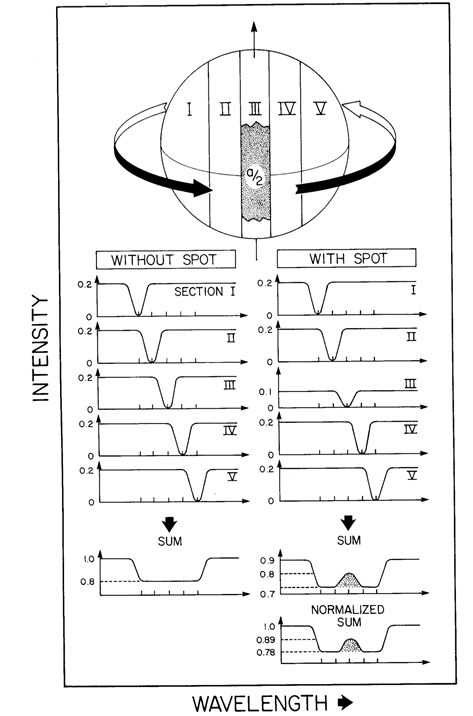
A large Doppler broadening (v sin i = 30 km/s typically) is necessary for detect photospheric spots. For the situation of HR 1099 the linewidths are well dominated by axis rotation, so spatial resolution of the disk is possible.
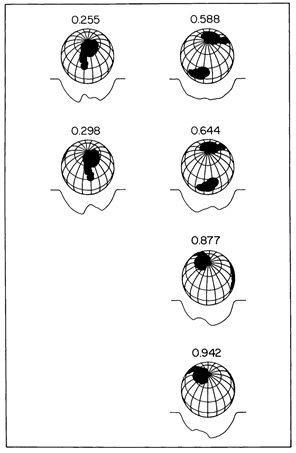
Below, example of line bumps observed during spot passage (note also the presence of G5 V secondary line, separed at the phase 0.588 and blended with the primary profile at phase 0.942) - figure extracted from the classical Vogt & Penrod paper:

And now, after "manual" deconvolution, the disk image can be obtained (see Vogt & Penrod paper for details)- note the presence of a polar spot:
More bibliography about HR 1099:
- Fekel, F. Astrophysical Journal, 268, 274, 1983) - Orbital parameters
- Vogt, Penrod, Hatzes, Astrophysical Journal, 321, 496, 1987 - Maximum Entropy Image Reconstruction
- Vogt, Hatzes, Mish, Kurster, ApJS, 121, 547, 1999
- Garcia-Alvarez & all (MUSICOS 1998 Campaign), arXiv ph/0303154v1 - 7 march 2003
Now my own observation of HR 1099 made between 18 October 2014 and 29 October 2014 from my urban observatory (Castanet-Tolosan Tolosan - France). The typical exposure time is one-hour. ISIS software is used for processing and analysis.
The phase is calculated from the equation: JHD = 2451142.943 + 2.83774E.
The spectral domain presented below is limited to the VHIRES-MO order #27.The more specifically analysed spectral line is Fe I 6065.5 I A, chosen because it is relatively isolated:
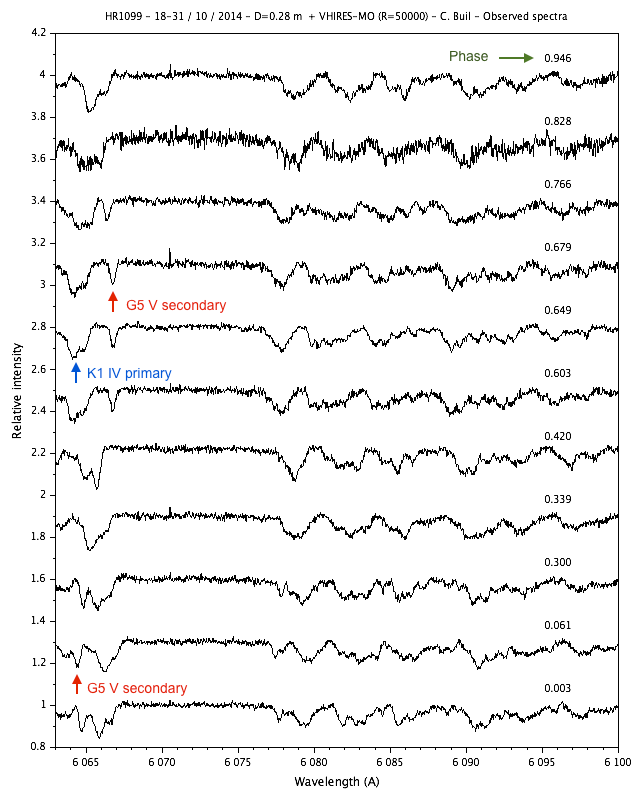
In this graph the continuum is shifted by 0.3 between earch observation for clarity.
Data interpretation is particularly difficult because the presence of dual lines system, the orbital Doppler shift of the two stars, the presence of spots...
The first operation was to suppress the spectrum of the star secondary G5 V. For this, I have observed in parallel to HR 1099, the type G5 IV star HD 5268 (3 x 600 sec. exposure).
I transformed HD 5268 spectrum by trial for obtain the same line intensities of the G5 V component in HR 1099. Furthermore, the lines in the HD 5268 have been broadened by a Gaussian convolution to meet the FWHM of secondary component in HR 1099. The following graph shows the G5 template spectrum:

Now the result of the substraction of observed HR 1099 and HD 5268 template (after a careful adjustment of the spectral shift of the secondary as a function of the phase):
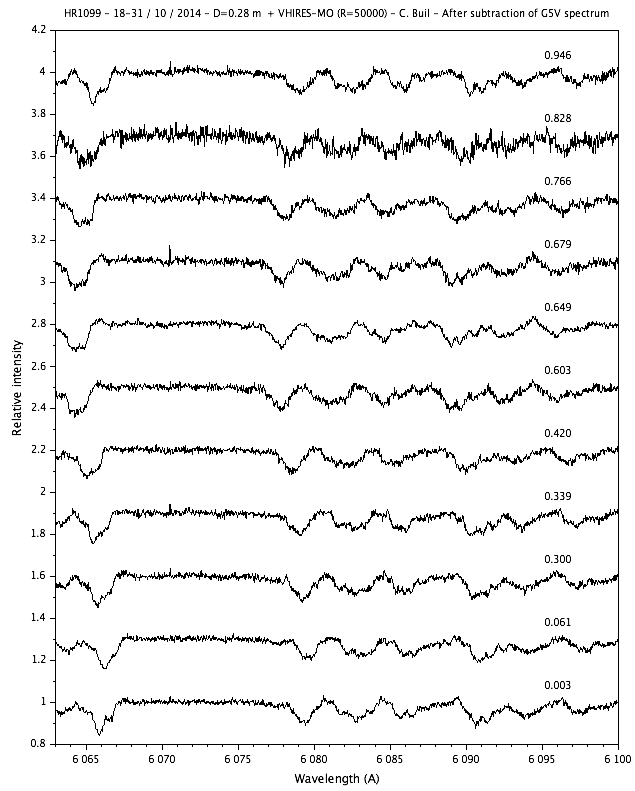
The spectral shift due to 2.8 days orbital motion of the main star remains to correct for better reveal the lines distortion associated to presence of spots. This operation is performed in the following graph (the reference radial velocity is arbitrary but of course the same for all observations):
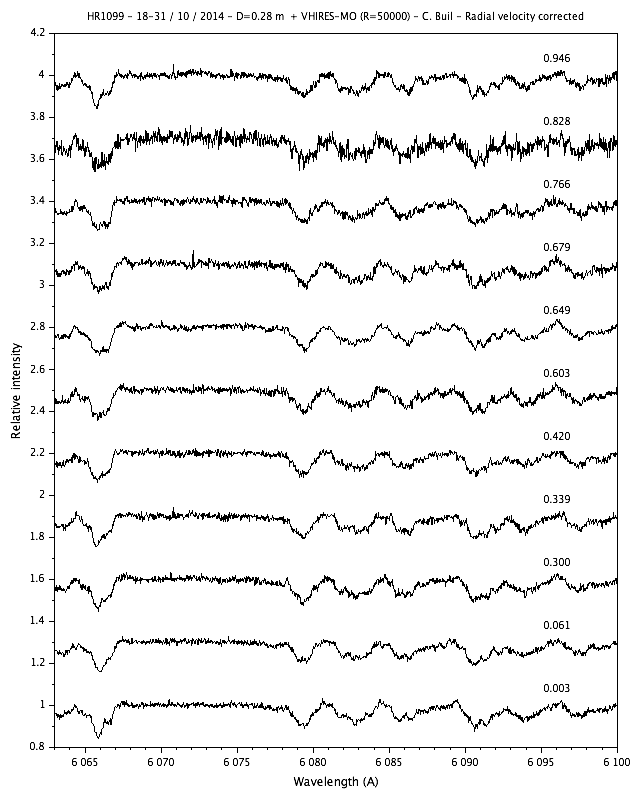
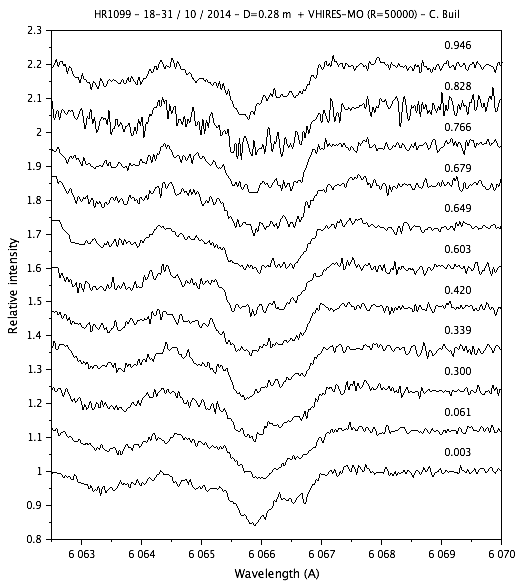
The time-series spectral profile of Fe I line at 6066 A show clearly presence of spot cyclic transients features. The transit of a large spot near the star equator is probably detected around phase 0. The detail of time evolution of Fe I 6066 A line:
Below, the specificity of HR 1099 by comparason with a "normal" K1 type standard:

The K1 IV spectrum of HD 1099 is compared to the similar star HD37984 (type K1 III) but not broadened by the rotation. The HD37984 spectrum (true VHIRES-MO spectrum) is transformed by convolution for simulate a nearly 30 km/s broadening spectral profile. You can compare now with the HR 1099 primary profile. Time change in the spectral produced by spotted surface is evident (also for the most faintest lines around 6090 A).
Aspect of Halpha line in function of date of observation:
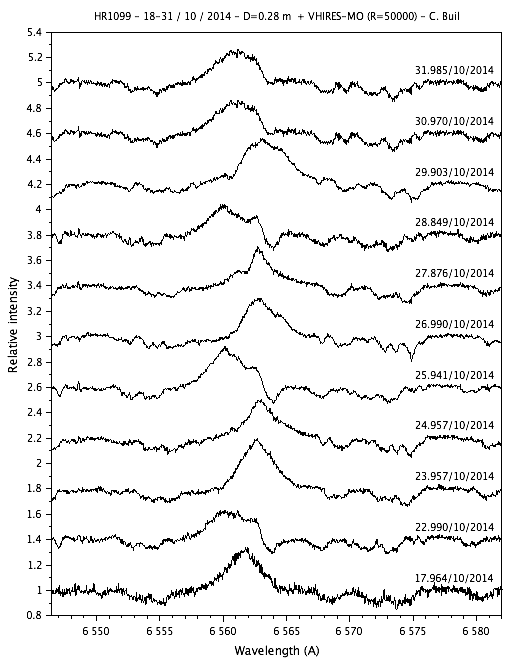
No clear correlation seem exist from date to date. Now, the aspect of Halpha in a phase diagram:

A correlation is now more evident: Halpha emission is coupled with rotation (persistant chromospheric structures ?).
I do not have for the moment mathematical tool for construct a Doppler image of the disk by using my spectral profile, but the key result is acquired: it is now possible by using spectra taken with amateur instrument to calculate the disk image of some stars by inversion of spectral line shape.
Clearly, Doppler imaging is one of the most fascinating applications of spectroscopy!