QSI-532 / QSI-583
CCD camera performances comparison
The serial # of tested QSI-532
is 502148. The serial # of tested QSI-583 is 503318.
General feature and measured
opto-electronic parameters
|
|
QSI
532
|
QSI
583
|
|
Pixel array
|
2184 x 1472 pixels
|
3326 x 2504 pixels
|
|
Linear array size
|
14.85 x 10.26 mm
|
17.96 x 13.52 mm
|
|
Pixel size
|
6.8 µm
|
5.4 µm
|
|
Quantum efficiency @ 656 nm (source:
Kodak specification)
|
80%
|
47%
|
|
Measured gain (inverse) at mid-dynamic
|
1.340 e- / ADU
|
0.485 e- / ADU
|
|
Measured readout noise @ -12°C
|
11.9 e-
|
8.7 e-
|
|
Measured relative quantum efficiency
@ 656 nm
|
1.62
|
1.00
|
Acquisition: Audela
software. The electronic gain is extracted from a photon transfer analysis.
Relative quantum efficiency is given by the ratio of integrated signal (circular
aperture) on the same stellar images.
Thorium-Argon lamp spectra sampling (spectra
taken with an eShel spectrograph)
|

|

|

|
|
QSI 516 - CCD KAF-1603ME
Pixel
size = 9µm. Spectral sampling = 0.153 A/pixel
|
QSI 532 - CCD KAF-3200ME
Pixel
size = 6.8 µm. Spectral sampling = 0.116 A/pixel
|
QSI 583 - CCD KAF-8300
Pixel
size = 5.4 µm. Spectral sampling = 0.092 A/pixel.
|
The 50 µm fiber diameter image is very well
resolved with the QSI 583 sampling. This oversampling increase probably the
spectral calibration precision and facilitate ThorAr lines identification (more
lines taken into account during calibration processing). Info about eShel spectrograph
click here.
Lag phenomena
QSI 532 model
|
 Saturated
30 seconds exposure. Saturated
30 seconds exposure.
|

|
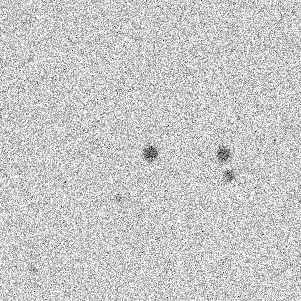
30
seconds dark image taken just after.
|
QSI 583 model
|

Saturated
30 seconds exposure.
|
|
30
seconds dark image taken just after.
|
The CCD lag of KAF-3200ME is significant (QSI
532 camera). Lag is absent in KAF-8300 image (QSI 583 camera).
Non-linearity response
Measurement non-linearity method: the ouput
signal (in ADU) from a stable light source is observed as a function
of exposure time (or illumination, product of flux intensity and integration
time).
QSI 532 model
QSI 583 model
Note: the experimental setup is improved for
QSI 532 model measure (the light source is a white LED + a very stable power supply)
in comparison to the QSI 583 model very noisy measure (the light source is a simple halogen
lamp).
The relative non-linearity relative gain g
is represented by the quadratic equation

where S is the measured counts (in ADU)
minus bias.
The expected counts (measured counts corrected
after linearization) S' is
given by (in ADU)

Coefficients of polynomial fits to non-linearity
measurements for QSI 532:
a0 = 1.0007, a1 = -1.8712 x 10⁻⁸,
a2 = -5.0816 x 10⁻¹²
Coefficients of polynomial fits to non-linearity
measurements for QSI 583:
a0 = 1.0054, a1 = -5.2482 x 10⁻⁷,
a2 = 8.9886 x 10⁻¹³
The observed non-linearity amplitude is similar for
the two cameras in the explored dynamic range. The change in the gain is
nearly 2-3% across the region from 3000 ADU and 63000 ADU, a reasonably low
value.
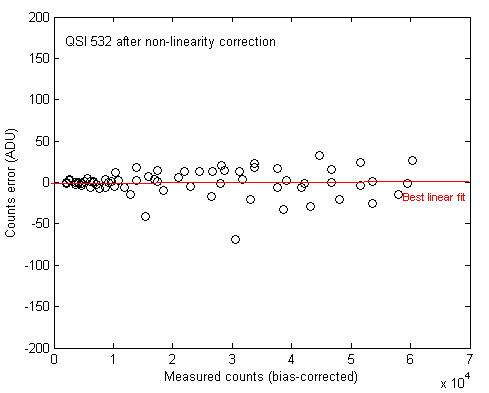
Residual counts error before and after simple quadratic
non-linearity correction of the QSI 532 measured signal:
|

|
|
|
QSI 532 non-linearity.
|
QSI 532 residual
non-linearity after 2nd quadratic correction.
|
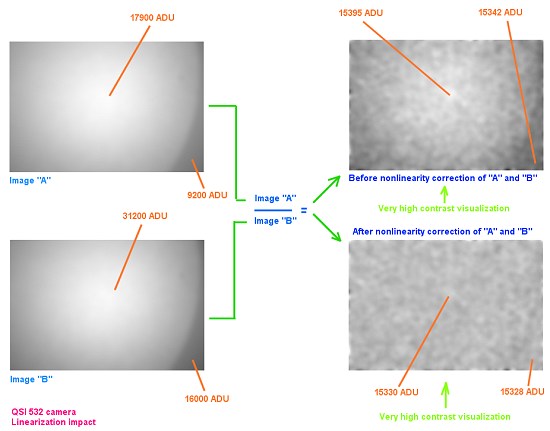
Linearization
demo (click on the image for enlarge)
Dark signal
Thermal signal histogram for the same acquisition
conditions:
|

|

|
|
Before gain
normalization (signal proportional to ADU)
|
After gain
normalization (signal proportional to electrons - i.e. true dark
signal)
|
The QSI 583 apparent dark signal in ADU (and thermal noise
in ADU) is slightly
superior. But if electronic gain difference is considered,after gain normalization (QSI 583 count level x 0.362), the true
dark signal (in electrons) per pixel is very similar for the two models (but
note also the ratio 1.26 between QSI 532 pixel surface and QSI 583 pixel surface,
not taken into account for calculate dark current per surface unit).
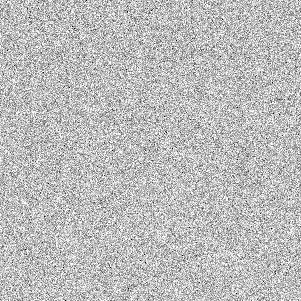
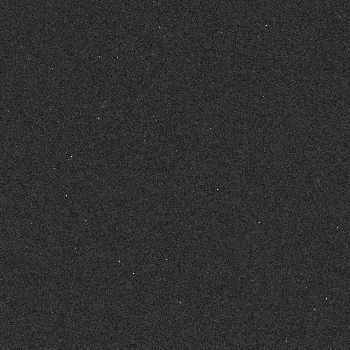
Aspect of dark image for the same command temperature
(-12°C), the same exposure time (60 s) and the same visualisation threshold:
|
|

|
|
QSI 532
|
QSI 583 before normalization
|
|
|
a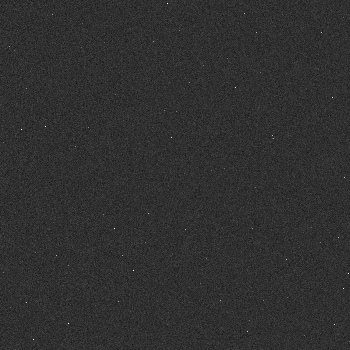
|
|
QSI 532
|
QSI 583 after gain
normalization
|
Back


