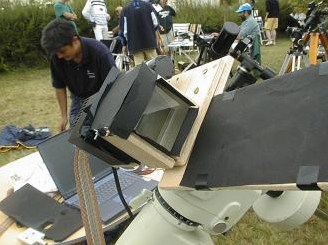
Figure 1. The grism is located in front of the Audine camera equipped with a 55 mm objective. A large sun-shield is placed in front of this unit to limit the inputs of parasitic light inherent to this assembly.
1999 solar
eclipse
Corona spectrum
This page presents the result of the observation of the spectrum of the solar
corona at the time of the total eclipse of August 11, 1999 in France. The observation
took place in the village of Sault Rethel, located at the north of Reims (Champagne-Ardenne).
The equipment consisted in an Audine camera equipped for the occasion with a KAF-1602E CCD, a photographic objective of 55 mm focal length and with a 700 lines/mm grism placed just in front of the objective. The unit was fixed on an equatorial mounting EM200.
The short focal distance from the objective was selected to cover a broad spectral range, from 4900 to 7700 A approximately. Average dispersion is of 2 angstroms/pixel. In counterpart, the image of the Sun is of small size: it is not possible to observe very fine structures with such an equipment. The compromise between the spectral resolution and the spatial resolution proved to be rather good in the final analysis.
Figure 1. The grism is located in front of the Audine camera equipped
with a 55 mm objective. A large sun-shield is placed in front of this unit to
limit the inputs of parasitic light inherent to this assembly.
The following image (integration time of 0.5 second at f/11) shows one of the spectra obtained. Blue is on the left and the red on the right. It is noted that the spectrum is tilted compared to the horizontal axis of the CCD. It is necessary to compensate it then to substract the dark current and the offset before being able to exploit it. The flat-fields were carried out on clouds,which invaded the sky in a permanent way a few minutes after the end of totality!
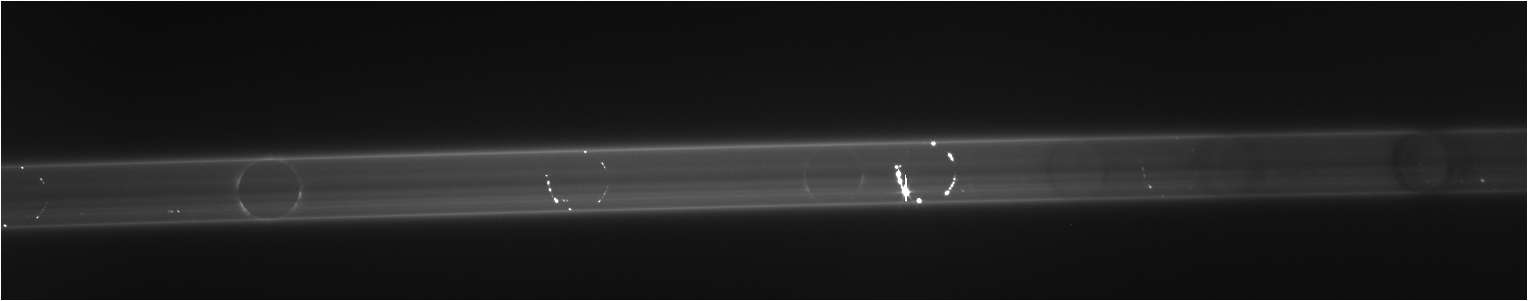 Figure
2. One of the two raw spectra
captured during the total phase of the eclipse.
Figure
2. One of the two raw spectra
captured during the total phase of the eclipse.
Figure 3 shows the result of the addition of two frames (integration time of 0.5 and 1 second). One easily distinguishes three types of monochromatic images of the Sun:
I. Some present a contour in chain. It is the image of
the chromosphere (the most intense image is caused by the line H-alpha at 6563
angtrsoms).
II. Others present a diffuse contour, coming from the corona itself.
III. Lastly, in the infra-red part (on the right) one distinguishes the absorption
lines caused by the gas component of the Earth's atmosphere (H2O and O2). It
is also necessary to mention a strong continuum which comes from the diffusion
of the photospheric light by the free electrons of the corona.
 Figure
3. The raw image of the
solar spectrum (co-adding of 0.5 and 1 second exposure).
Figure
3. The raw image of the
solar spectrum (co-adding of 0.5 and 1 second exposure).
The following step of the processing is the elimination of the continuum which disturbs the detection of the spectral lines. There are several possible techniques. We chose a broad median filter (30 pixels in the present case) along the horizontal axis only. The result is an image of the continuum, free of spectral lines. One then substract this continuum from the image of figure 3 to obtain the image of figure 4.
The principal chromospheric emission lines in the explored spectral area are caused by hydrogen and helium. The green line of iron 13 times ionized is particularly intense to 5303 A. The red line of the solar intern corona is well quite visible to 6375 A. On the other hand, the 14 times ionized yellow line of calcium is detected but extremely weak (it is perceptible only in the zones of strong coronal activity) whereas it is often quoted in the literature as a major emission of the corona. Note that Fe X, Fe XIV and Ca XV lines represent, respectively, plasmas of 1.106, 2.106 and 3.5.106 K temperatures. Other coronal emissions are visible, one will note in particular iron 14 times ionized almost confused with the chromosperic line of helium at 7065 A.
 Figure
4. The spectrum of the corona
and the chromosphere cleaned from the continuum. Note that the solar image presents
an ovalization (the disc is stretched horizontally in the blue part and vertically
in the red part). It is the result of the variation of spectral dispersion because
of using a grism. Dispersion is 1.8 A/pixel at 4900 A and 2.2 A/pixel at 7000
A.
Figure
4. The spectrum of the corona
and the chromosphere cleaned from the continuum. Note that the solar image presents
an ovalization (the disc is stretched horizontally in the blue part and vertically
in the red part). It is the result of the variation of spectral dispersion because
of using a grism. Dispersion is 1.8 A/pixel at 4900 A and 2.2 A/pixel at 7000
A.
The following figure shows the image of the protuberances in the 5876 A line of helium. One notes the presence of a weak image of the Sun caused by the emission of the sodium pair (separation of the lines: 6 A).

Figure 5. Enlargement of the image of the Sun in the 5876
A line of helium. The protuberance located at the extreme left is detached from
the solar limb. The emission of sodium is also detected in this image.
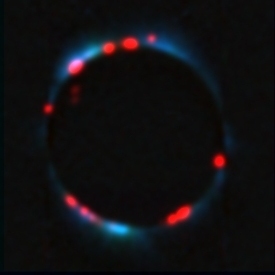
Figure 6 illustrates how the details of the corona are different according to the analyzed spectral line. The monochromatic images have been registred for this reason.
|
|
Figure 6. The internal corona observed in the line of Fe XIV on the left and in the line of Fe X on the right. The morphology of the corona is strongly modulated according to the level of ionization.
|
|
|
Figure 7. At left, coloured composition made up in the following way: blue is given by the 5303 A line, the red is given by the 6375 A line, the green is given by the average of these two last images. The image thus does not visualize the feeling of truths colors since the line at 5303 A, which normally is green, is here the blue component of the 3-color process. The ratio of intensity between lines 5303 A and 6375 A is respected, however the calibration that takes into account the spectral response of the CCD is not carried out yet. At center, the same image as previously after increasing the details in the most remote corona. At right one superimposed the chromospheric lines colored in red (He I). One notices that the details in the corona, when associated with active region of the solar surface, are not correlated at the time of the observation with the visible chromospheric activity on the limb.
Bibliography:
La couronne solaire - J P. Rozelot -
Doin 1973
Solar Astronomy Handbook - Beck &
all - Willman-Bell 1995