The CCD being sensitive between 4000 A and 9000 A, the linear extension of the spectrum is (9000-4000)/4752=1,05 mm. If the CCD is a KAF-0400, with pixels 9 microns on a side, computing the spectrum length in pixels is easy : 1,15/0,009=117 pixels. In general if e is the linear size of a pixel, then this pixel covers a spectral element whose size is
One should not distinguish between the value of spectrum sampling, as previously computed, with the spectral resolution. The theoretical value of the latter is given by :
m = the number of grooves per millimeter
L = the grating's lit width
k = the grating's order
With d the distance between the focal plane and the grating, the grating's lit width when observing a pointlike object is
The main aberration affecting our system is chromatic coma. As its name implies it depends on wavelength. The dimension of the coma as a function of the wavelength is given by
With N=4 and l=6500 A, the chromatic coma is 152 A, equivalent to an aigrette's length of 0,032 mm. Resolution is then 43. The only way to improve things is to use a slower telescope, but this is less than ideal. First because reducing the field's size is not a good idea if it is desired to observe many objects at the same time, and also because increasing the focal length also increases star sizes, which in turn implies a loss in resolution (read further on).
Figure 4 shows image spots in the focal plane for 3 wavelengths, computed by ray-tracing in the example's optical configuration.
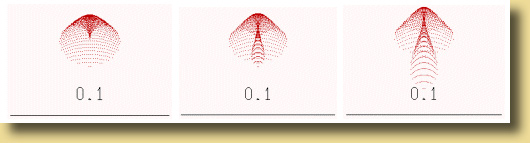
A typical characteristic of a coma, as is visible in figure 4, is that 80% of the energy is in fact concentrated in one half of the image spot. Hence the previous formulae give a pessimistic result. They are often replaced by the following formulae that better take into account the energy repartition in the image spot:
Images on figure 4 are spoiled by some astigmatism. In our disposition it has a linear dimension of
If a =-b, astigmatism is null for the wavelength l0 corresponding to emergence angle b. To this end one must give the grating an angle such that incidence and diffraction angles be equal, as is shown in figure 5.
The a angle that corrects for astigmatism at wavelength l0 is given in radian by

The last aberration affecting our system is field curvature, due to the fact that the spectrum does not have a planar shape but rather a cylindrical one. Of course, since the CCD detector is flat, focus cannot be readily achieved for every wavelength in the spectrum. Because of astigmatism, there are in fact two focal surfaces, one related to the sagittal image (the image of a pointlike object is lengthened along the dispersion direction), the other related to the tangential focal (the image is lengthened perpendicularly to the dispersion direction), with a curvature radius of d/3. It is this last surface that we wish to position as close to possible of the CCD plane by focusing the telescope, since the spectral lines are themselves perpendicular to the dispersion direction.
The difference in focal position between the image at order 0 and the point of the spectrum corresponding at refraction angle b is given by :
It is possible to greatly improve the quality of our spectrograph by adding an optical component: a small angle prism with one side positionned against the grating. If the latter is directly engraved on one face of the prism, then we have an optical element called a GRISM, a contraction of the words "grating" and "prism". The presence of the prism completely cancels chromatic coma for a chosen wavelength l0.

If n is the refraction index for the prism, it can be shown that the prism's angle g is expressed by
The length of the residual coma's aigrette for another spectrum point at wavelength l is


Click here for another grims configuration.
Finally, it is very important to remember that the FWHM (Full Width at Half Maximum) directly determines spectral resolution in a slitless spectrograph. Tracking quality shall be maximized, also the telescope should be properly focused and tuned for optical quality. Turbulence itself should be low. For all these reasons, it is often easier to obtain good spectra with short focal lengths than with longer ones (a simple zoom lens corrected for chromatism can be as efficient as a 200 mm telescope for spectral resolution). If the figure for FWHM is 2 pixels and dispersion is 47A/pixel, then it will not be possible to reach a better spectral resolution than 2 x 47 or 94 A.
Using numerical applications as described in this page, taking into
account the dimensions of your CCD detector, with the goal of studying
weak objects' spectra, you should find that the best grating to be used
will have at most 70 to 200 grooves per millimeter!
 |
 |
 |