Back
Audine with Ethernaude = non-linearity measurements with radiometric method
The CCD is cooled and I wait a long time for the temperature to stabilise as much as possible. The illumination source is a red LED,
connected to a very stable power supply (0-15V with residual ondulation smaller than 5mV). I switch the LED on, and again I wait a long time for it
to stabilise. The LED is in a box and the CCD is half inside the box (the side which receives light) and half outside (for the fan
to remove the heat from the Peltier efficiently without heating the inside of the box). A sheet of paper is placed inside the box,
between the LED and the CCD to get uniform illumination. The room is in complete darkness.
test A
When the CCD temperature is stabilised, I take the following exposures:
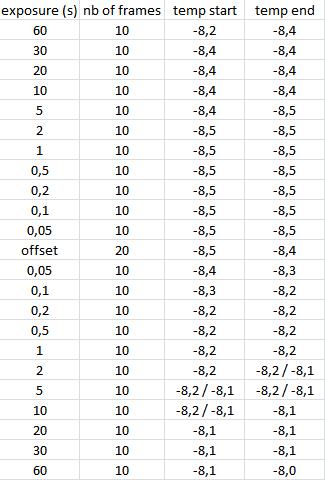
The CCD temperatures (or more precisely, the temperatures given by the sensor in the CCD cold holder)
are indicated at the beginning and end of each line, for each serie of exposures.
Most of the time the temperature was between -8.1°C and -8.4°C.
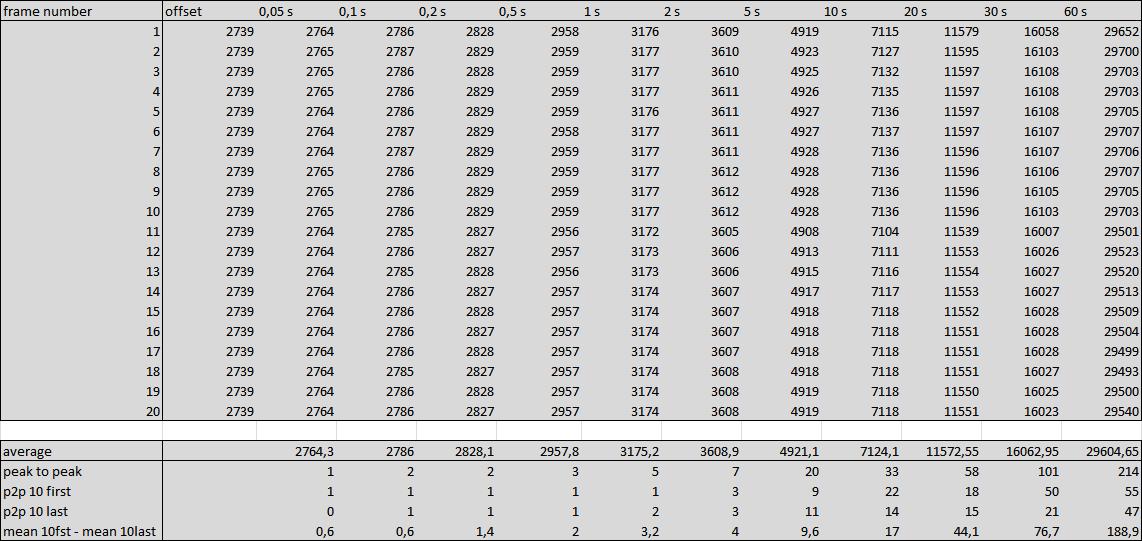
The variability of the measured signals due to the small temperature drifts can be seen in the table below,
which shows the median values of each frame:
test B
Another day, I repeated the test but with stronger illumination, so that only shorter exposures were possible. (By the way, the CCD
saturation is at 32767 ADU.) The frames and their temperatures are given below:
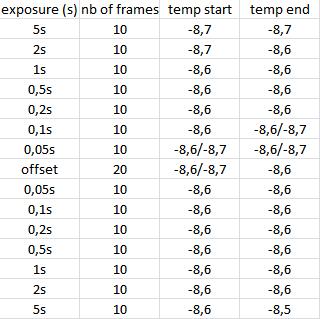
Now the variability of the measured signals is of course better than for test A, due to the shorter exposures and thus smaller temperature
drifts. The mean values (not the median this time, sorry) are given in the table below:

Remarks:
1- I should say that the acquisition was quite long for test A, longer than an hour. In such conditions
it would have been very painful to completely mixed the temporal order of the various exposures, so that they see in average equivalent conditions
(i.e. taking 1 frame 60 sec, 1 frame 0.2 sec, 1 frame 10 sec, 1 offset, etc..). Instead, Prism is taking automatically 10 frames,
then I re-parametrise it for a new acquisition, etc. This is much more practical and realistic.
2- the non-linearity curves that I have calculated are the same when considering all exposures, or the 10 first or 10 last. This indicates that the small
temperature drifts did not affect significantly the measurements. Thanks to this, I could perform the non-linearity analysis with all available data.
3- the idea of repeating the test with a different signal level was to discriminate, for the observed non-linearities, between the impact of
a constant offset which would be the same for both experiments (i.e. time delay of shutter), and a non-linearity that would depend on
the level of signal (i.e. due to the amount of electrons stored in each pixel) and thus would occur for at different exposures for test A and test B.