|
by Lorenzo Comolli - Written in April 2014 - Thanks to Alessandro for taking all the images |

Introduction
In this page you'll find a technical test. Please refer here for an introduction, details and testing method.
Available sensitivities:
To distinguish between true and software interpolated sensitivities, the best method is to look at the histogram of a nearly uniform image (like a flat field). The result is shown in the figure below, and the conclusion is:
In this page you'll find a technical test. Please refer here for an introduction, details and testing method.
Available sensitivities:
- standard: from 100 to 25600 ISO with 1/3 EV steps
- extended: 50 ISO, 51200 ISO and 102400 ISO
-
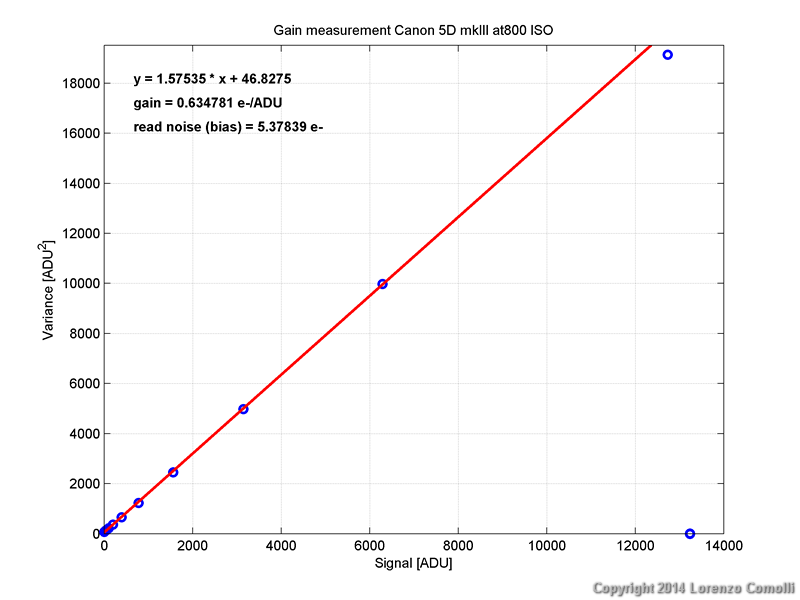
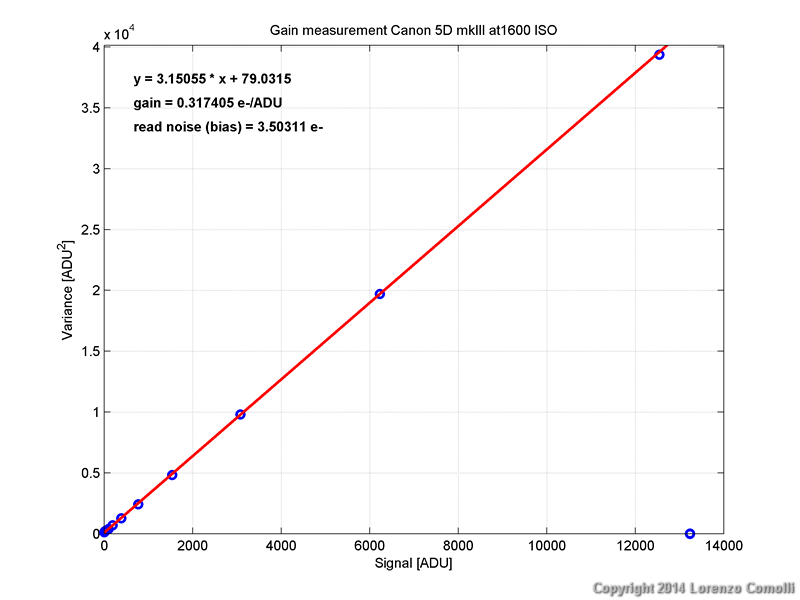
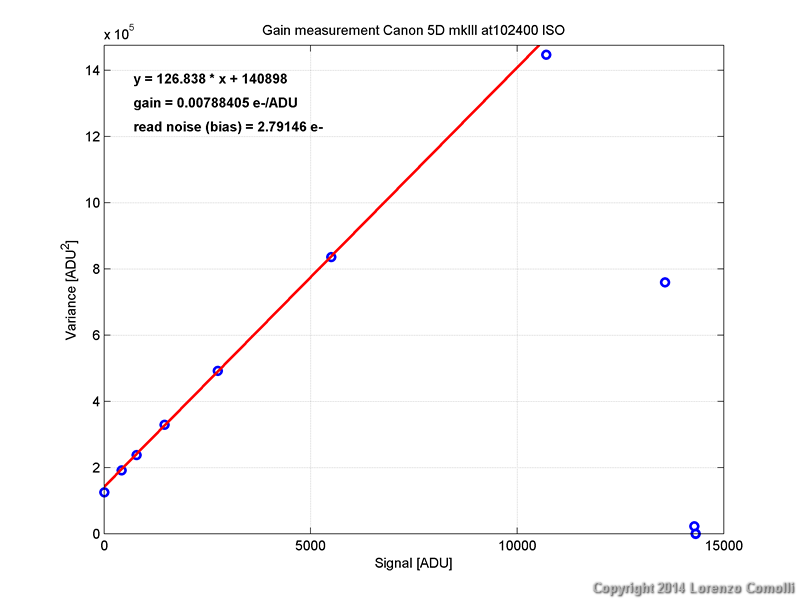
Gain. The measured gains
follow quite accurately the power law. Exceptions are 50 ISO, as
expected, that is exactly the same as 100 ISO (only JPG files are
affected, RAW are absolutely identical). Another exception is 102400 ISO
that is a little bit less sensitive than declared (i.e. larger inverse gain).
- Unity gain at 500 ISO
- Read noise. A
constant
decrease is found up to 12800 ISO. Using 25600 ISO or more produces no
improvements
on the read noise (and even worser, read noise appear to increase a
little bit for 25600 ISO and above). I've also repeated some tests at
high sensitivity to confirm this behavior. So I advise not to use
anything
more than 12800 ISO,
the only effects of using more is to reduce the dynamic range and to worsen a little bit the read noise. Obviously
this advice is valid only for RAW files, in JPG it is worth using higher
sensitivities. For
best results in low light circumstances mainly use 12800 ISO.
- Dynamic range. Considering the actual saturation level for each ISO, the dynamic range is computed and reported both in the table and graph below. The best dynamic ranges are at 100 ISO and 200 ISO; but also 400 and 800 ISO has a very similar dynamic range. Using 50 ISO does not improve in any way the dynamic range (in the RAW files): as known the 50 ISO setting in RAW is identical to 100 ISO. Above 800 ISO the dynamic range start to decrease noticeably. For best results on bright subjects, use 800 ISO or less.
- 1/3 stop sensitivities. Main
result: absolutely don't use them!
In example 1000 ISO has the same read noise of 800 ISO, but lower
dynamic range, so it is better to use 800 ISO. And 1250 ISO has the same
read noise of 1600 ISO and also the same dynamic range (because
saturation is at a lower level), so there is no advantage to use 1250
respect 1600 ISO. As a general rule, simply avoid 1/3 stop ISOs!
To distinguish between true and software interpolated sensitivities, the best method is to look at the histogram of a nearly uniform image (like a flat field). The result is shown in the figure below, and the conclusion is:
- 51200 ISO and 102400 ISO are not true sensitivities, as expected.
- 25600 ISO is not true even if it is declared not to be "extended".
- 1000 and 1250 ISO (intermediate 1/3 stops sensitivities): as
explained above, they do not produce anything better that full stop
ISOs. So I advise to avoid them. Also looking at the histogram of the 1250 ISO image, something strange appear.
- 100, 200, 400, 800, 1600, 3200, 6400, 12800 ISO are true.
| ISO | gain | read noise | Dynamic range |
| [e-/ADU] | [e-] | [dB or 6*EV] |
|
| 50 |
5.2094 |
35.063 |
65.87 |
| 100 | 5.1315 | 34.489 | 65.89 |
| 200 | 2.5905 | 18.299 | 65.45 |
| 400 | 1.2508 | 9.482 | 64.84 |
| 800 | 0.6348 | 5.378 | 63.87 |
| 1000 | 0.5053 | 5.484 | 61.72 |
| 1250 | 0.4013 | 3.550 | 62.10 |
| 1600 | 0.3174 | 3.503 | 61.58 |
| 3200 | 0.1610 | 2.547 | 58.45 |
| 6400 | 0.0793 | 2.348 | 53.01 |
| 12800 | 0.0403 | 1.964 | 48.69 |
| 25600 |
0.0213 | 2.058 | 43.42 |
| 51200 | 0.0119 | 2.254 | 37.59 |
| 102400 | 0.0079 | 2.791 | 32.13 |


Histograms

Details of measurements at each ISO setting