
HET617, Computational Astrophysics, 2004
Dr. Amanda Karakas, supervisor
1. Introduction
If one should elect a paradigm for Astrophysics, stellar evolution certainly would be within the first places. All known luminous matter, except Hydrogen and a few Helium was synthesised in the cores of stars, and in the supernovae explosions of massive stars. Due to this fact, the actual element abundance in the Universe is a consequence of the work of these celestial bodies.
other literature, stellar evolution is mainly treated by enhancing the role of stellar mass, leaving initial stellar metal abundance to a second plane. For example, the background literature supporting this module barely refers to this subject (see references).
The aim of this project is to study the stellar evolution from the metal abundance point of view, in order to fill the gap I found in the literature about this subject.
2. Background
The physical background presented below has its main sources the material from the Swinburne unit HET 611, as well as the University book “An Introduction to Modern Stellar Astrophysics” from Dale Ostlie and Bradley Carrol. Whenever relevant, focus will be given to the effect of metallicity in the physical quantities involved. The material in this background shall be sufficient to explain all the differences observed during the stellar evolution. Part of the text relative to opacity and energy generation was introduced in order to best understand the principles related to the tables.
Vogt-Russel Theorem: “ The mass and composition of a star uniquely determine its radius, luminosity and internal structure, as well as its subsequent evolution”.
A- Equations of the model
A stellar model must be defined through three fundamental items:
- The equations of the stellar structure, that represent the behaviour of fundamental
physical quantities with the stellar radius.
- The constitutive relations, which describe the properties of the stellar matter.
- The observed properties.
1- The equations of the stellar structure are four, representing the pressure, mass, luminosity, and temperature variation with the stellar radius. The equations assume that the stars are spherically symetric, and that acceleration effects are negligible.
The equation of electrostatic equilibrium
dP/dR=-G MRr/r2 (1)
States that a pressure gradient must exist in order to counteract the force of gravity.
The equation of mass conservation
dMr/dR=4pr2r (2)
shows how the interior mass of a star changes with the distance from the centre.
The equation of energy production, for a shell at distance r
dLr/dR=4pr2re (3)
Lr is the interior luminosity due to the whole energy generated within the radius r.
The equation of energy transport, describes the temperature gradient and depends on the conditions within the star for radiative or convective transport.
The equation for radiative transport is given by
dT/dR=-3/(16pacr2) kr/T3 Lr (4)
with a º 4s/c, the radiation constant and k the mean opacity. If the gradient becomes too steep as in the case of a sudden decrease in temperature from one region to another, then convection may be the main way for energy transport.
The equation for the convective transport, assuming that the temperature gradient is adiabatic, is given by
dT/dR=-(1-1/g) mmH/K GMr/r2 (5)
where g is the ratio of the specific heat of the gas and K is the Boltzmann constant. g=5/3 for a monoatomic gas, and g»1 for a highly ionised gas (Swinburne). For convection to occur it is necessary that
d lnP/d lnT < g/(g-1) (Ostlie, 1996)
In the case of a monoatomic gas, g=5/3, makes d lnP/d lnT <2.5 the threshold for convection to occur.
The conditions for convection to occur in stars, are:
- Large stellar opacity, imposing a steep temperature gradient for radiative transport (4)
- Ionisation occurs in the zone, increasing the specific heat and decreasing the adiabatic temperature gradient (5).
- Low local gravitational acceleration, g º GMr/r2 decreasing the adiabatic temperature gradient (5).
These conditions may explain the existence of the convective envelope and its size change during the evolutionary phases of a star.
- Nuclear reaction rates with high temperature dependence may cause steep temperature gradient (4), due to the abrupt changes in Lr.
That is the case of CNO and triple alpha reactions discussed below, whose reaction rates are extremely temperature-dependent (Ostlie).
2 – The constitutive relations, a set of equations of state, are needed in order to complement information to the equations of stellar structure, based on the composition, temperature and density of the stellar material. The constitutive relations must be asserted for the pressure P, the opacity k, and for the rate of energy generation e. These parameters are very complex, but some good approximations may be found. The pressure equation of state may be represented by
P= rKT/mmH + 1/3 aT4 (6)
Where the first member of the equation is the ideal gas law and the second the radiation pressure. m is is the mean molecular weight, dependent on the composition, and mºmav/mH being mav the average mass of a gas particle and mH the mass of the hydrogen atom. For the case of a completely ionised gas, as found in stellar interiors, the mean molecular weight is given by
1/mi » 2X + 3/4Y + 1/2Z (7)
with X, Y and Z the mass fractions of hydrogen, helium and metals respectively.
In the case of our models,
Z=0.02, Y=0.2928, X=0.6872 Þ mi=0.633
Z=0.004, Y=0.2476, X=0.7484 Þ mi=0.594 (8)
Z=0.0001, Y=0.23, X=0.7699 Þ mi=0.584
The stellar metallicity will then influence the mean molecular weight. An increase of the mean molecular weight will decrease the gas pressure (6).
The opacity defines the way the photons generated by the nuclear reactions interact with the stellar matter. This photonic interactions with the stellar matter may happen in four ways:
- bound-bound absorption, when a photon is absorbed by an atom, inducing an electron transition in the atom. For this to happen, the photon must have an appropriate wavelength with the same energy as the electron. This type of opacity may only happen in zones where the atom are not completely ionised, never in the stellar interiors.
- bound-free absorption, when a photon is energetic enough to ionise the atom.
- free-free absorption, happens when a free electron near an ion absorbs a photon, causing an increase in the speed of the electron. The inverse process, when an electron slows down in the neighbourhood of an ion, emitting a photon, is known as brehmstrahlung.
- electron scattering, when a photon is scattered by colliding with a free electron. This cause of opacity is common in the interior of stars, where most of the gas is ionised and the electrons are not bound to the atoms.
A direct conclusion from the above is that the total opacity, the sum of all the four opacity contribution, is directly proportional to the electron’s density. Opacity is wavelength dependent, except for electron scattering. The Rosseland mean opacity is the average of the opacity at all wavelengths, in order to represent opacity only as a function of temperature, density and composition, as in the constitutive relations. The role of composition is well enhanced in the expressions for bound-free, free-free, and electron scattering:
kbf = 4.34x1025 gbf/t Z(1+X) r/T3.5 cm2/g
kff = 3.68x10²² gff (1-Z)(1+X) r/T3.5 cm2/g (9)
kes =0.2 (1+X) cm2/g
where gbf, gff and t are correction coefficients, and X and Z the fractional mass for hydrogen and metals respectively. These expressions are only an example on how the Rosseland mean opacity may be determined, and represent just a simple approximation.
However, it is interesting to see the weight of composition in each type of opacity, although it is insignificant when compared with the temperature weight in the bound-free and free-free equations. In the case of our models, bound-free opacity will heavily increase with metallicity, free-free opacity will decrease with metallicity, and electron scattering will slowly decrease with metallicity.
|
Z |
Z(1+X) |
(1-Z)(1+X) |
(1+X) |
|
0.02 |
0.0337 |
0.307 |
1.6872 |
|
0.004 |
0.007 |
1.741 |
1.7484 |
|
0.0001 |
0.0002 |
1.77 |
1.7699 |

![]()
The model databases as the one in Swinburne simulator uses opacity tables , previous calculated and often updated, because “model results are sensitive to modest changes in the opacity” (Iglesias et al.,1996). For the Swinburne database, OPAL Rosseland mean opacities were used (Iglesias et al, 1996).
The third constitutive quantity is the rate of energy generation. It can be presented as a power law with different coefficients for different energy zones, as e=e0rTh. For example, the following equations may represent the rates of energy generation for the principal reactions inside the stars of low- middle-mass:
epp»e0,pprX2yppfppT64
eCNO»e0,CNOrXXCNOT619.9 (10)
e3a»e0,3ar2Y2f3aT841
with TnºT/10n, ypp, fpp and f32 correction factors, X and Y hydrogen and helium mass fractions respectively and XCNO the mass fraction of carbon, nitrogen and oxygen.
For Swinburne database, a compilation of reaction rates, the NACRE (Nuclear Astrophysics Compilation of Reaction rates) was used. (Arnould et al., 1999)
All the above can represent a stellar model, by solving the four structure equations, plus the pressure equation of state, being opacity and energy rate values given by tables. In order to solve the differential equations, boundary conditions must be defined:
- if the model is presented as a function of radius, then the boundary conditions shall be: at the stellar centre, as r®0, the mass M®0, and the luminosity L®0. At the surface, as r®R*, the pressure P®0, the temperature T®0, and the density r®0.
- if the model is presented as a function of mass instead of radius, then the boundary conditions shall be: at the centre, as m®0, the luminosity L®0,and the radius r®0; at the surface, as m®M*, the pressure P®0, the temperature T®0, and the density r®0.
3 - The observed properties are based on the colour, magnitude and spectrum of the star. The colour gives the information of the temperature of the star, the magnitude the information of the luminosity and the spectrum the information of composition. For any stellar model, all the physical quantities calculated must agree with the observed properties.
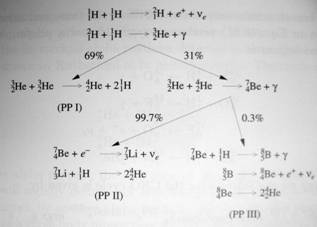
B – The nuclear reactions


![]()
The nuclear reactions in the interior of stars are processed through nuclear fusion. The heavier the atoms to be fused, the higher the temperature must be in order to fusion to take place. Stars begin by burning hydrogen in their cores. In stars below 1.2 solar masses this process is dominated by the pp-chain in three ways (Fig.1). The required temperature for pp-chain to take place is T=8x10⁶ K. In stars heavier than 1.3 solar masses, with higher central temperatures (T=20x106 K), the H-burn is done through the CNO cycle, in two ways, the second one occurring just 0.04% of the time (Fig.s 4 – 5). When there are conditions for helium to burn in the stellar core (T=100x106 K), the triple alpha reaction fuses He into carbon (Fig. 4). Later, some of the carbon atom capture one more helium atom producing oxygen (Fig. 5).
![]()
![]()
C – Limitations of the model
No model yet can be taken as the perfect representation of the real star. As seen above stellar models are defined through tables and equations. The equations in order to be solvable are subject to simplifications, which only represent a limited portion of a much complex reality. The tables, as the above mentioned for opacity and for rates of energy generation, are subject to periodical corrections, leading to a better description of the models. Quantification of mass loss in the late evolutionary stages of low- to middle- mass stars is still an issue (Lattanzio et al., 2001). Although it is mentioned in the literature that rotation and resulting magnetic fields are “assumed to have little effect in most stars” (Ostlie), differential rotation of a star must at least influence convective zones; the equations describing convection are developed assuming an adiabatic condition, which may be altered by the rotation.
D – Method
The simulator uses a huge database developed by Lattanzio and co-workers. There are three ways to get out information from the database: create graphics, compare graphics, and create movies. For this work, the main interest is to compare the evolution of models of the same mass with different initial metallicities. First, the Hertzprung-Russel diagram (HRD) was taken for each phase of evolution (H-burn, He-burn, AGB) in three metallicities for each stellar mass. One solar mass, three solar masses, and five solar masses were used as well as Z=0.0001, Z=0.004, and Z=0.02 metallicities. As the HRD plots the luminosity vs. Teff, a plot of luminosity vs. time was also needed. From then on, the more important physical characteristics were plotted for each evolutionary phase. As the comparative graphics against time are sometimes too steep, simple graphics plot were taken in these situations. Movies of the several quantities against mass were taken for all the models in study. The aim was using the information given by the comparative graphics to freeze the movies in precise epochs of the evolutionary phase, plot all the variables in a single graphic, in order to best understand the dynamics in the stellar interior, as Iben did (Iben, 1967).


3.From ZAMS to AGB


For reasons of clarity and simplification, only two stellar masses will be presented here, two one-solar mass models of Pop.I and Pop.II, and two five-solar mass models of Pop.I and Pop.II. The Pop.I models have initial metallicity of Z=0.02 and the Pop.II models have initial metallicity of Z=0.0001 (Fig.s 6 – 7).
A - Zero-Age Main Sequence (ZAMS) and Main Sequence
All the stars begin their life at ZAMS, the door entrance for the main sequence where they spend the major time of their life, about 90%, burning hydrogen in their cores.
At ZAMS, Pop.II stars are hotter, more luminous and have smaller radius than Pop.I stars, regardless of their masses; the central temperature is higher in Pop.II stars. Due to this, the nuclear reaction rates are higher at the core of Pop.II stars (10). On the other hand, the opacity, which comes mainly from metals, is lower in Pop.II stars. This results in a more efficient escape of the energy generated in the core, increasing the stellar luminosity; for the same reason, the radiation pressure over the envelope is lower, allowing the hydrostatic equilibrium with gravity to be achieved at a smaller radius.


During the main sequence all stars are fusing H into He. In stars below about 1.2 solar masses (threshold depending on Z), the pp-chain is the main source of energy, whereas in stars more massive than that, the CNO cycle takes place. As seen before (10), CNO cycle has a temperature dependence roughly to the 20th power which may induce a steep temperature gradient favouring convection as the energy transport in the core (Fig.s 10 – 11).
For stars below 1.3 solar masses, depending on the metallicity, a convective zone may form near the surface, due to the increase of opacity, as the effective temperature decreases (Fig.s 8 – 9). In Pop.II one-solar mass star, the opacity near the surface is not enough to form a convective zone.


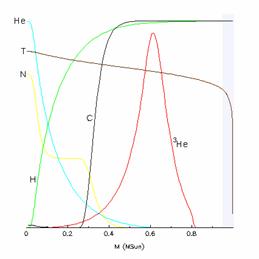
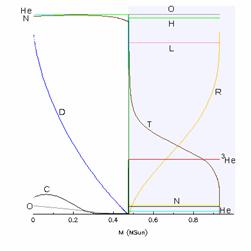
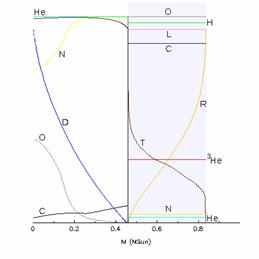
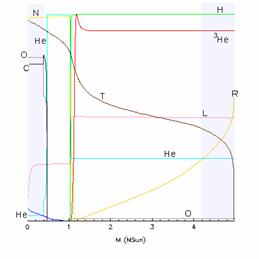
As stars evolve in the main sequence, the mean molecular weight increases at the core, due to the transformation of H into He. This increase of m, assuming that T and r are constant, will decrease the gas pressure in the core (6), resulting in a core compression. This core compression leads to an increase of the core’s temperature and density, resulting in a migration of the stars up in the HRD (more luminous. Figures 8 and 9 represent the comparition between one-solar mass Pop.II and Pop.I stars, and figures 10 and 11 the same for five-solar mass stars at half-main sequence. They show the distribution of the mass fractions for 1H, 3He, 4He, 14N, and 12C, as well as the temperature for the one-solar mass case more 16O and luminosity L for five-solar mass star as a function of interior mass. The shadowed parts correspond to convective energy transport.

 Figures 12 and 13 for one-solar mass
stars and figures 14 and 15 for five-solar mass stars represent the mass
fractions, temperature and luminosity at the end of the main sequence as a
function of interior mass. These figures reveal clearly that Pop.I stars take
longer in the main sequence than Pop.II stars of the same mass. This is due to
the fact that Pop.II stars have hotter cores than Pop.I stars leading to higher
energy generation rates, thus exhausting the core fuel in less time.
Figures 12 and 13 for one-solar mass
stars and figures 14 and 15 for five-solar mass stars represent the mass
fractions, temperature and luminosity at the end of the main sequence as a
function of interior mass. These figures reveal clearly that Pop.I stars take
longer in the main sequence than Pop.II stars of the same mass. This is due to
the fact that Pop.II stars have hotter cores than Pop.I stars leading to higher
energy generation rates, thus exhausting the core fuel in less time.


![]()


The
convective core disappears for five-solar mass stars. At this time the nuclear
reactions cease at the core. For one-solar mass stars a thick H-burning shell remains
around it (The “X” zone where H and He cross in the figures). This shell is more
luminous than at the time of core H-burning and, as a result, the stars continue
to increase the luminosity displacing up in the HRD. The shell will use H from
the envelope and will produce He to the core. This increases the mean molecular
weight of the near isothermal core, decreasing its pressure and resulting in the
core’s contraction. In the outer side of the shell, energy produces radiative
pressure on the envelope, inducing a slow expansion of it. The result is a
decrease in Teff, with a migration of the star in the HRD towards the
right. In five-solar mass stars an overall contraction will take place between
the end of the reactions in the core and the beginning of the H-shell burning,
releasing gravitational energy and increasing L and Teff, resulting
in a migration in the HRD to up and left. When the H-shell ignites, the star
will deflect to the right and down of the HRD (cooler and less luminous). At this time, the stars reached the
base of the red giant branch. At this stage, the maximum mass
fractions of 12C, 14N, and 16O (in five-solar
masses) are higher by 102 in the Pop.I stars, the sub product 3He
remains constant in the different populations, Teff is higher in
Pop.II stars and well as the luminosity.
B - Red Giant Branch (RGB)

At the base of the RGB, five-solar mass stars show the structure of Figure 16, with a dead He core, surrounded by a H-burning shell, feeding the core with He, and causing the H, He rich envelope to expand and cool.


At this phase, lower mass stars have a very different evolution from higher mass stars. The main difference is that lower-mass stars cannot attain the necessary temperature to the triple-alpha reactions before the core gets electron degenerate. Due to this, the ascent of the RGB for low-mass stars takes a lot of time, compared with higher-mass stars. One consequence of this is the mass loss suffered by the lower-mass stars: the rate of mass loss in low to middle-mass stars is identical for stars of the same population, but as lower-mass stars spend more time in that phase, they loose comparatively more mass. This fact is clearly represented in Figures 17 and 18 for one-solar mass stars, Pop.II and Pop.I respectively, when compared to Figures 19 and 20 for five-solar mass stars at the tip of RGB. The time between the end of the main sequence and the tip of RGB is 4x10⁸ years in Pop.II and 2.5x10⁹ years in Pop.I for one-solar mass stars, and about 2x10⁶ years for five-solar mass stars of both populations. Low-mass Pop.I stars loose more mass than low-mass Pop.II stars.


 “The mass loss does
not affect significantly the internal structure of models” (Girardi, 2000). As
the envelopes expands and cools, a convective envelope develops due to the increase
of opacity, mainly caused by the contribution of the H- ion (Ostlie,
1996). This convection zone may increase up to the zone where the nuclear
reactions are taking place. Whenever this happens, the phenomenon is known as
dredge-up (first dredge-up in this case), resulting in the transport of elements
from the envelope inwards and the transport of processed material to the outer
parts of the star. For one-solar mass stars of both populations, this took place
when the mass of exhausted core (data from the simulator) and the convection,
the shadowed zone in Figures 17 and 18 intersect. As a result, the mass
fractions of processed material in the envelope increased. In five-solar mass
stars the first dredge-up only took place in the Pop.I star (Fig. 20). One
reason for the dredge-up not occurring in Pop.II star is that the temperature at
the envelope is much higher at the Pop.II star’s envelope not allowing the H-
ion to form, not increasing the opacity necessary to develop a convective energy
transport (Figure 19).
“The mass loss does
not affect significantly the internal structure of models” (Girardi, 2000). As
the envelopes expands and cools, a convective envelope develops due to the increase
of opacity, mainly caused by the contribution of the H- ion (Ostlie,
1996). This convection zone may increase up to the zone where the nuclear
reactions are taking place. Whenever this happens, the phenomenon is known as
dredge-up (first dredge-up in this case), resulting in the transport of elements
from the envelope inwards and the transport of processed material to the outer
parts of the star. For one-solar mass stars of both populations, this took place
when the mass of exhausted core (data from the simulator) and the convection,
the shadowed zone in Figures 17 and 18 intersect. As a result, the mass
fractions of processed material in the envelope increased. In five-solar mass
stars the first dredge-up only took place in the Pop.I star (Fig. 20). One
reason for the dredge-up not occurring in Pop.II star is that the temperature at
the envelope is much higher at the Pop.II star’s envelope not allowing the H-
ion to form, not increasing the opacity necessary to develop a convective energy
transport (Figure 19).
C – He-Burning


 In lower-mass stars, where the core
is electron degenerate, this process happens abruptly in a helium core flash.
This is a highly energetic reaction, very short in time, that never reaches the
stellar surface, being the energy absorbed by the envelope. Due to the high
temperature dependence of the triple-alpha reaction, roughly to the 41th power
(10) the core becomes convective. Figures 21 and 22 show the stellar structure
and composition during He-burning for one-solar mass Pop.II and Pop.I stars, and
figures 23 and 24 the same for five-solar mass stars. By the figures, the
H-burning shell, centred where H and He cross, is the dominant source for
luminosity.
In lower-mass stars, where the core
is electron degenerate, this process happens abruptly in a helium core flash.
This is a highly energetic reaction, very short in time, that never reaches the
stellar surface, being the energy absorbed by the envelope. Due to the high
temperature dependence of the triple-alpha reaction, roughly to the 41th power
(10) the core becomes convective. Figures 21 and 22 show the stellar structure
and composition during He-burning for one-solar mass Pop.II and Pop.I stars, and
figures 23 and 24 the same for five-solar mass stars. By the figures, the
H-burning shell, centred where H and He cross, is the dominant source for
luminosity.


With the reactions in the core, it expands and the rate of energy generation in the shell decreases. The envelope contracts leading to an increase of Teff. The stars will migrate to the left in the HRD, in a track known as the horizontal branch (HB). Metal-rich stars will migrate to the left of HRD lesser than metal-poor ones; “the luminosity of the HB stars is determined primarily by the composition Y of their main sequence progenitors” (Chiosi, 1992). As the mean molecular weight increases in the core, due to the reactions, the core pressure decreases, resulting in a core contraction and consequent envelope expansion and cooling.


When the helium in the core is exhausted, the structure of the star will be the one in Figure 25: a CO core, surrounded by a He-burning shell, a convective helium intershell, a H-burning shell, and the H, He envelope. The extinguished core contracts and heats while the envelope expands and cools. The cooling imposed by the He-burning shell , due to the expansion of the outer envelope is enough to extinguish the reactions in the H-shell. The stars evolve to the asymptotic giant branch phase (AGB).
The influence of composition at the core He-burning phase may be resumed as follows:
- the luminosity of HB stars depends on the He abundance of their main sequence progenitors (Chiosi, 1992).
- Pop.II stars show higher displacement to the blue in the HB phase than Pop.I star (Chiosi, 1992).
- the rate of core He-burning is higher in Pop.II stars.
D – AGB
The AGB evolutionary phase is the last phase discussed in this work, and it is the phase before low/medium mass stars become white dwarfs by loosing their envelopes. This phase is divided in two stages: the early AGB that lasts until the H-shell is re-ignited, and the thermally pulsating AGB that lasts from H-shell re-ignition until the loss of the envelope.


 With the cooling of the envelope,
with the consequent increase in opacity again the convective zone deepens into
the stellar interior. In low-mass stars the progression of the convective
envelope is stopped by the He-burning shell, but in more massive stars the
envelope will reach the zones where material was processed, in a second
dredge-up (Lattanzio et al., 2001). Figures 26 and 27 show the internal
structure and composition for Pop.II and Pop.I respectively for one-mass solar
stars at the early asymptotic giant branch (EAGB) phase. One can clearly see
that the convection did not reach the zone of H-shell.
With the cooling of the envelope,
with the consequent increase in opacity again the convective zone deepens into
the stellar interior. In low-mass stars the progression of the convective
envelope is stopped by the He-burning shell, but in more massive stars the
envelope will reach the zones where material was processed, in a second
dredge-up (Lattanzio et al., 2001). Figures 26 and 27 show the internal
structure and composition for Pop.II and Pop.I respectively for one-mass solar
stars at the early asymptotic giant branch (EAGB) phase. One can clearly see
that the convection did not reach the zone of H-shell.


 Figures 28 and 29 show a Pop.II and a Pop.I
five-solar mass stars in the phase just before the dredge-up taking place, and
Figure 30 shows the Pop.II star during the second dredge-up. Here, the
convection zone clearly intersected the H-shell zone, mixing He and N into the
envelope. The cooling of the envelope and the luminosity due to the H-shell,
displaces the stars in a track parallel to the RGB in the HRD.
Figures 28 and 29 show a Pop.II and a Pop.I
five-solar mass stars in the phase just before the dredge-up taking place, and
Figure 30 shows the Pop.II star during the second dredge-up. Here, the
convection zone clearly intersected the H-shell zone, mixing He and N into the
envelope. The cooling of the envelope and the luminosity due to the H-shell,
displaces the stars in a track parallel to the RGB in the HRD.


The expansion of the envelope will be stopped by its one cooling, initiating a phase of contraction, heating and re-igniting the H-shell.
At the EAGB, it is the mass difference rather than the composition that defines the different behaviour of the stars during that phase.
The TPAGB begins with an electron degenerate core, and two shells, one burning He and another burning H, separated by a convective He intershell zone. With the ignition of the H-shell, the narrowing He-burning shell becomes unstable turning on and off periodically. The sources of luminosity will alternate between He-burning shell and H-burning shell (Fig. 31).


The H-burning shell will be active the most part of the time alternated by helium flashes. The helium flashes occur due to the deposition of He by the H-burning shell, imposing a partial electron degeneracy in the He-shell. With the He-flash the H-shell is extinguished by the star’s expansion. The H-burning shell works as a barrier against the progression of the convective envelope. When it extinguishes, the convective envelope deepens intersecting the H-shell, causing the called third dredge-up, that may repeat during the He pulses.


Figure 32 shows the mass of H-exhausted core for a Pop.I star and figure 33 shows the inner edge of the convective envelope for the same star at the same evolutionary phase. The intersection of the inner edge of the convective envelope with the mass of the H-exhausted core takes place by the time of the He pulses; and clearly dredge-ups occur during the pulses.

After the He-shell flash effect, the H-shell re-ignites repeating the cycle until the star looses all its envelope. At this phase it is interesting to note the behaviour of the different populations. The information is taken from the simulator results:
Pop.II one-solar mass stars show more helium shell luminosity than Pop.I stars.
Pop.II five-solar mass stars show less helium shell luminosity than Pop.I stars
Pop.II one-solar mass stars show less H-burning shell luminosity than Pop.I stars
Pop.II five-solar mass stars show less H-burning shell luminosity than Pop.I stars
The mass-loss rate increases with the metallicity.
4. Conclusion
The major conclusion that can be taken is that the mass of a star has more influence in the stellar evolution than its composition.
The fact that Pop.II stars are hotter and more luminous at ZAMS make them more efficient in creating elements heavier than H due to the higher energy generation rates.
Low-mass stars loose mass during the ascent of the RGB. By the simulator results, Pop.I stars loose more mass than Pop.II stars at this phase. This mass loss will enrich the interstellar medium. Heavier portions of metals will be given to the ISM by Pop.I stars, as shown in figures 17 and 18, where the portion of carbon and oxygen is higher by » 102.
During the whole evolution of stars, mass-loss rate is assumed to increase with metallicity. Pop.I stars tend to loose more mass during their evolution than Pop.II stars. In middle-mass Pop.II stars the first dredge-up did not take place (Fig. 19), not mixing the inner heavier elements with the envelope. Higher mass-loss rates associated to the first dregd-up found in all Pop.I stars, mixing heavier elements in the envelope, make these stars more efficient in contributing to the metal abundance increase in the ISM than Pop.II stars.
The fact that Pop.II stars are hotter and more luminous than Pop.I stars may not be valid for more metallic stars. A paper from Mowlavi (1998) shows clearly that high metallic models (Z=0.1, Y=0.48) at ZAMS are hotter and more luminous, compared to the solar composition stars. If the tendency is to have a more metallic ISM, then in the future more metallic stars will exist than today. The rate of metallicity generation will then increase exponentially, since the more metallic stars will take less time to produce heavier elements. Evidently, low to middle-mass stars are efficient in producing metals up to iron, and few heavier ones, through the nuclear slow process. The progressive metal enrichment of the ISM may, however, reach a limit, which may be imposed by the limit itself of the gas metallicity viable for the formation of a star.
References
Non-explosive hydrogen and helium burnings:
Abundance predictions from the NACRE reaction rate compilation
M. Arnold et al.
Astron. Astrophys. 347, 572-582 ,1999
New Developments in Understanding the HR Diagram
Chiosi. C.
Annu. Rev.Astron. Astrophys, 30:235-85, 1992
Evolutionary tracks and isochrones for low- and intermediate- mass stars: from 0.15 to 7 Msun and from Z=0.0004 to 0.03.
Girardi L et al.
Astronomy & Astroph. Supp. Series, V.141, P.371, 2000
Stellar Evolution within and off the Main Sequence
Iben, I
1967 Annual Review A & A, V.5, P.571
Updated OPAL Opacities
Iglesias, C et al.
The Astrophysical Journal, 464:943-953, 1996
Evolution and Nucleosynthesis of AGB Stars: Current Issues
Lattanzio, J et al.
Mem.S. A It., Vol. 72-2, 2001
Grids of stellar models
Mowlavi, N. et al.
Astronomy & Astroph. Supp. Series, V.128, P.471-474, 1998
An Introduction to Modern Stellar Astrophysics
Ostlie and Carroll
ISBN 0-201-59880-9, 1996
Image Credits
Figures 1, 2 , 3, 4, 5, 16, 25 – from Ostlie (1996)
Figures 6, 7, 31, 32, 33 – from Swinburne simulator
Remaining figures – from the author