|
|
|
Ionospheric Perturbations
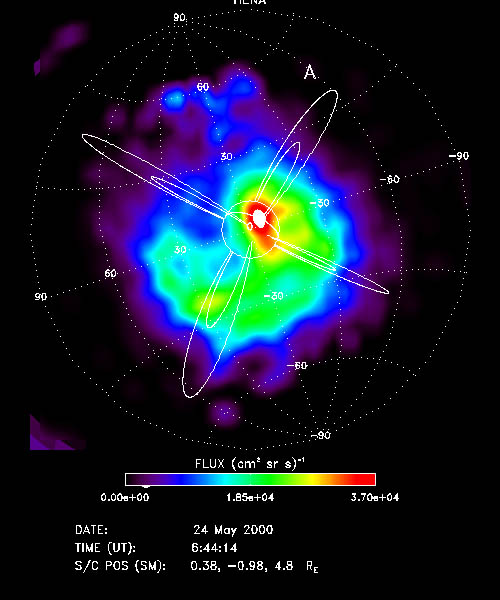
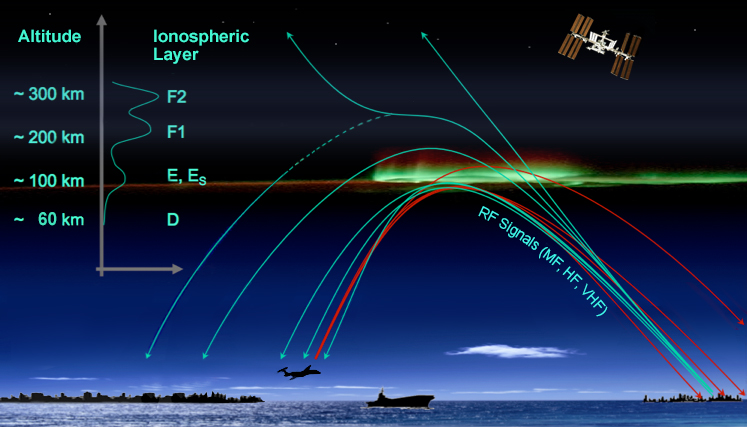
A disturbing star (I) Since the pioneer works of Grote Reber, W9GFZ, in 1937, the ones of first broadcasters and from the Royal Air Force on first radars at the end of World War II, we all know that the main source of radioelectric perturbations is our sun. Its surface activity, especially chromospheric eruptions, Coronal Mass Ejections (CME) as well as its electromagnetic and particle radiations can potentially modify the ionosphere constitution and affect the geomagnetic field, disturbing their properties. These intense radiations, heavy particles and other fast moving bubbles of gas move away from the sun at a few hundreds km/s prisonned in the solar electromagnetic field. After ten minutes or so for the fastest or a couple of days these radiations collide with the geomagnetosphere and induce indirectly an increasing of the level of ionization of the ionosphere. Sometimes the hit is very beneficial, sometimes much less. How work these mechanisms and how do they affect the ionospheric propagation ? Sky wave propagation Radio waves reaching the ionosphere layers are called sky waves. Only these ones allow long distance propagation (DX). To understand how they can be affected by the sun activity, we must first of all define characteristics of the ionosphere and its properties. Then we will focus on solar radiations, geomagnetic and ionospheric disturbances to close in dealing with solar an geomagnetic indices and their effects on critical frequencies like MUF, LUF and other FOT. The ionosphere is constituted of several layers of ionized gas acting like as many reflecting surfaces more or less open or transparent to shortwaves depending on their density and the incident angle of the signal. From up to down, physicists defined three main "reflecting surfaces" : - F-layer, divided in F1 and F2 at daytime, it allows long distance propagation - E-layer, accessible between 80 and 2m bands, it vanishes at night - D-layer, its absorbs radio waves at daytime in the 160-40 m bands, degrades the MUF but does not intervene in DX. Several additional effects increase also reflectivity or waves : -
Plasma clouds (sporadic-E) - Gray line (along the line of the terminator) - Azimuth (tilts, horizontal gradients, plasma irregularities, etc). In addition, properties of the signal will influence its propagation: - Distances involved between the transmitter and the receiver - Ground properties (dielectric constant, conductivity, resistivity, etc) - The antenna takeoff angle - The working frequency vs. the critical frequency - The ouput power - The modulation mode (CW, SSB, etc) If we want to work remote stations, sky waves must be reflected one or more times to the ground by the ionospheric layers. Some have to be highly ionized to reflect sky waves while other must be transparent in order that sky waves could travel across to reach higher layers. But several factors that will be developed below and in the next pages affect their ionization level and their response to sky waves propagation : - The amount of electromagnetic radiation and particle emissions (X-flare, EUV, UV, CME, solar wind, etc) emitted by the sun and their variation according the time of day and time of year - The status of the geomagnetic field (Ap and Kp indices) The relation between all these variables where hard to correlate, and until recently we even didn't know that CME had a so strong impact on the Earth ionosphere. To well understand how develop ionospheric perturbations, we have to divide this study in two parts : first, determine what solar radiations are able to disturb either the ionosphere or the geomagnetosphere, then what components of the geomagnetosphere affects the radio propagation and in which way. At last from these data we could create a model of the ionosphere to establish forecasts.
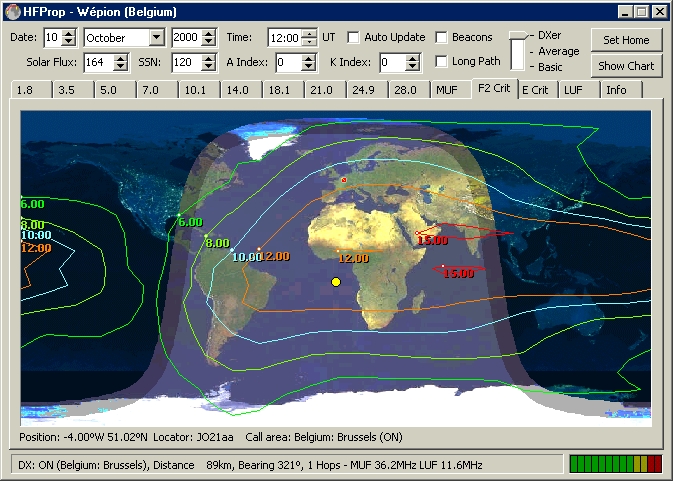
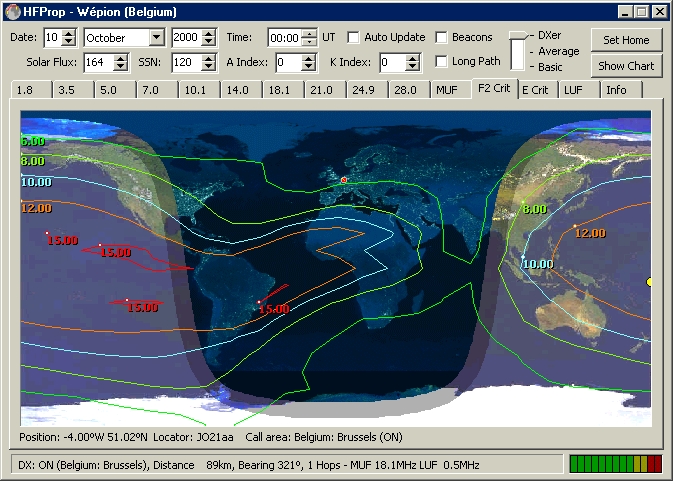
Variations of the ionosphere We have seen in the chapter dealing with the radio propagation that the ionosphere shows several layers, ranging from the D-layer at 90 km of altitude, and the F-layer located between 200 and 300 km of altitude. Its structure at any location is complex and depends mainly on the frequency, the amount of EUV light coming from the sun and the electron density (the rate of photoionization or recombination). The fact that the ionosphere is created by the solar activity suggests that its variation will be similar to the one of the air temperature. And indeed, we observe that globally the electron density of the ionosphere is the greatest in summer, at noon and over the equator. But this picture is uncomplete. Due to the EUV radiation, that follows the 11-year solar cycle, the ionosphere varies much more than this. We can define five main variations of the ionosphere : Diurnal variation As its name suggests, these variations occur only throughout the day, following the apparent movement of the sun. They affect the D, E and F1 layers depending on the solar activity, and the solar zenith angle over the location. The E-layer does not completely vanish at night and stays around a critical frequency foE = 0.6 MHz, but one often considers that its drops to zero and vanish at night as it as little consequence on radio propagation. The F1-layer becomes a separate layer only at daytime and mainly during 3 to 4 hours before and after local noon. It disappears after sunset leaving the place to the F-layer located higher in altitude. The F2-layer variation is more complex. Its critical frequency foF2 reaches is the lowest level (about 2-4 MHz), just before dawn, after the recombination process eliminated all electrons. The foF2 rises rapidly after sunrise due to the photoionization, amplifies during the day (to reach about 15 MHz near the equator), then decreasing at sunset but it never vanishes. Surviving the night, the F2-layer is the most important layer for HF communications. Software review : SWIM, PropLab Pro, STD Aurora monitor
Seasonal variations The ionosphere varies also with seasons. In winter for example, the sun is always lower over the horizon than in summer (zenit angle higher in winter than in summer). This affects the critical frequencies of the D, E and F1-layers that is greater in summer than in winter. But this is the opposite for the foF2 at mid-latitudes that shows is greatest variation in winter. This difference is known as the "mid-latitude seasonal anomaly" and finds its root in seasonal changes in the relative concentrations of atoms and molecules. Latitudinal variations As with seasonal variations, the solar zenith angle affects also the ionosphere with latitude. Critical frequencies of each layer are not superposable and show considerable difference at low, mid and high-latitudes. Variations from day to day As the air temperature varies following the 24-hour cycle and from day to day, so do the critical frequencies of the ionosphere in reponse to the change of EUV radiation from the sun. Changes occuring sometimes at a very fast rate in the low atmosphere (within 5 minutes), usually one ignore most of these details and one works in terms of average behaviour of the ionosphere for the month, at each of the 24-hours of the day. These values are divised in three groupes : median (valid 50 % of the month), lower decile (valid 10 % of the month) and upper decile (valid 90 % of the month). If the true critical frequency measured with a digisonde is much lower or higher than on the remaining days (respectively the 15, 27 or 3 other days on the month) we speak of "disturbed days". They are all associated to a deep change of the solar activity.
Variation with the solar activity Considering only the day-to-day variations of the ionosphere, we cannot describe its behaviour with accuracy as many other indicators affect propagation conditions. Among them, name the solar flux characterized through its electromagnetic and particle emissions which is the main factor affecting the ionosphere. Its impact is obvious if we use a calibration graph showing the monthly median value of foF2 as a function of SSN. The foF2 double of frequency in winter when SSN jumps for example from 50 to 100. Remind also in this context that instead of using the SSN to estimate the status of the ionosphere, we can use the ionospheric index T which is a measure of the ionosphere itself. It is performed by a group of stations in order to cancel out local variations and leaving only those common to all stations. Plasma blasts in the ionosphere Highlight a last phenomenon recently discovered in the ionosphere and visually spectacular : sprites and blue jets. Beside gamma rays lightnings detected in the ionosphere, in 1989 astronauts recorded the first pictures of sprites, and in 1994 the Geophysical Institute discovered an absolutely amazing phenomenon. Between 75 and 95 km of altitude, bright bluish plasma jets like the one displayed above shoot up from thundery supercells top (lines of cumulo-nimbus). This event last only two or three milliseconds. Researchers think that these ionization blasts are linked to the ionospheric activity. Since that time, Spaceweather has dedicated a special image gallery to these sprites. In all cases, we are at some orders of magnitude above the harmless HAARP experiments about which some people complain in regards with their potential effects in the atmosphere ! (Note that according to ARRL, HAARP project shut down in May 2013 but restarted in 2017). Next chapter
|
||||||||||||||||||||||||||||||
