|
|
|
Review of HF propagation analysis & prediction programs
58 programs at a glance
Since
the release of the first Windows environment in 1985,
some publishers and amateurs have created small Windows applications on-the-air
oriented giving an overview of propagation conditions. Drawback of their simplicity, most show
approximate predictions, and very few use the flexibility of multi-windowing.
None of these applications use the
VOACAP engine or a down-sized version of the IRI model, except some methods
(e.g. E-layer) used in CCIR noise model. All these applications give thus forecasts
with a 50% reliability as all them use median values and don't take into account all
parameters of a communication circuit.
Most
of these applications display only a couple of parameters, the MUF and LUF for
either a specified circuit or at global scale. Some programs provide in addition
a point-to-point prediction with a relative indication of field or signal
strength or S/N ratio at the target location. Others, more user-friendly,
display the global status of the ionosphere on an active map, the user clicking
on any location to get the MUF over that area or the signal strength for a
point-to-point circuit. The most recent programs, designed specially for Windows
32-bit platforms, are however more complete, providing for example either critical
frequencies or downloading from the Internet spaceweather bulletins, alerts or images dealing with
the current solar and geomagnetic activity.
Do not hesitate to give me your feedback
with any additional information.
DOS
Programs -
Non-VOACAP - VOACAP-based
Beacon
monitors - Web
& Research oriented
|
|
DXToolBox - HFProp - AREPS
- SpotPath
- W6ELProp
- DXProp
/ PropHF
ASAPS - HF-Prop
- PropWiz - Propagation
Predictor - IONSOUND Turbo
|
|

Black
Cat Systems
License,
$24.99
|
DX
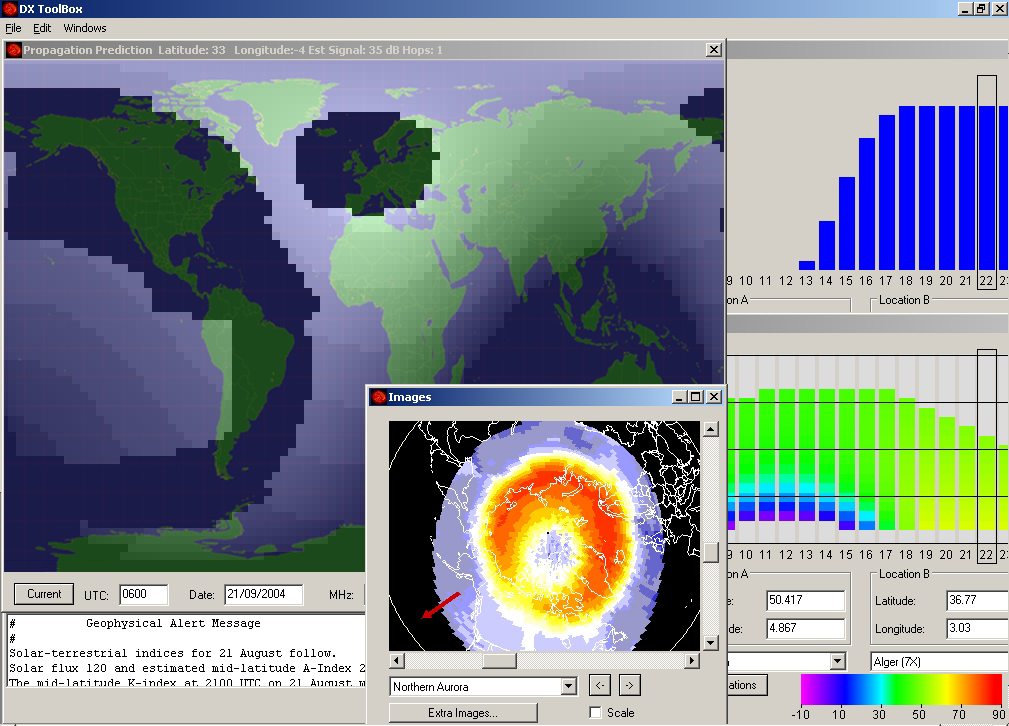
ToolBox
A
special effort has been done to provide a program easy to use, fast
with an attracting GUI. DX ToolBox uses online solar and geomagnetic
data to calculate propagation estimations. Results are displayed in
a large propagation map. Clicking anywhere on the map you can
display the target location coordinates, the signal strength, and
the number of hops.
All current solar and geomagnetic parameters can
be displayed in four additional charts (Current conditions, Solar
wind, Magnetic field and Solar data extracted from SEC and ACE
websites). In addition MUF and LUF to a target location are
displayed in a 24-hour chart using a rainbow indicator to predict
the signal strength expressed in dB. A gray-line map permits to
follow beacons in real-time, to display short paths, heading and
distance to target locations. Long path are not supported yet. At
last thanks to its Internet connection, it can also download and
display in real-time various bulletins (WWV, Geoalert, etc) and
images from any website.
Only drawbacks, it doesn't use either the VOACAP or the IRI model and shows thus some
approximations (MUF, silent zone, top band, etc). Windows
are also fixed excepted the one related to images and bulletins. I
should have give it four stars but working without the VOACAP
engine, it lacks globally of accuracy but I like much its GUI.
Now
at version 4.6.3, DX TooBox is available for
all Windows and Mac platforms (incl. OS/X, iPhone, and iPad).
It requires an active Internet connection for get online updates. Read
my review.
License,
$24.99. 30-day-fully-functional free trial.


|
|
G4ILO
Shareware
|
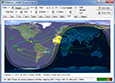
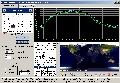
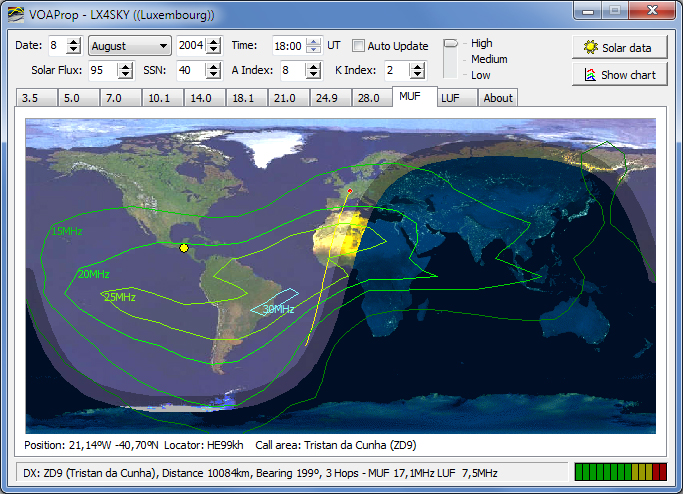
HFProp
To
not confuse with the old USAF bulletin of the same name and other
homonyms.
Developed
in 2000 by Julian Moss, the latest corrections where added in 2002.
The GUI is user-friendly and displays a realistic world map showing
even cities lights in the darkness (compare the left screen dump to
this satellite
picture).
The screen is limited to a window of 673x481 pixels. A second small
window pops up when you request the MUF/LUF chart. This very simple and light propagation
program (~700 KB) takes into account the solar flux or the smoothed sunspot
number and planetary indices. Interesting feature, when you type the
SFI, the equivalent SSN is displayed and vice versa, an option that
I use regularly as a "converter" to enter one or the other
index in other applications.
HFProp uses Fricker's F2-layer prediction model. Offering an
original and user-friendly interface, it displays iso-contour frequency
maps on a gray-line cartesian world map, predict the DX activities for each band,
the F2 and E critical frequency, and MUF. In addition it displays a MUF/LUF chart
and the strength of you signal to the receiver based of rough assumptions and statistical data.
The
new version 1.3 released in 2004 also includes a connection to the
Internet (you can type any URL, for example to NOAA's WWV messages)
and an automatic updater to get current solar flux and K index.
These new features are very appreciated.
While
version 1.2 was a freeware, version 1.3 is a shareware. By
default the two critical frequency charts are not displayed, but can be enabled
(as can maps for other bands, including broadcast bands) by
right-clicking the map and selecting "Set visible tabs". HFProp runs on
all Windows 32-bit platforms. Read my review.
Today
these versions are no more available and the time window stops end
2009 but you can download the version
1.3 installer from this site. They have been replaced by VOAProp
that uses the VOACAP engine. It uses the same interface as the this version, and you can download it free of
charge on G4ILO's website.
|
|

US
NAVY
Freeware |
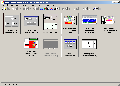
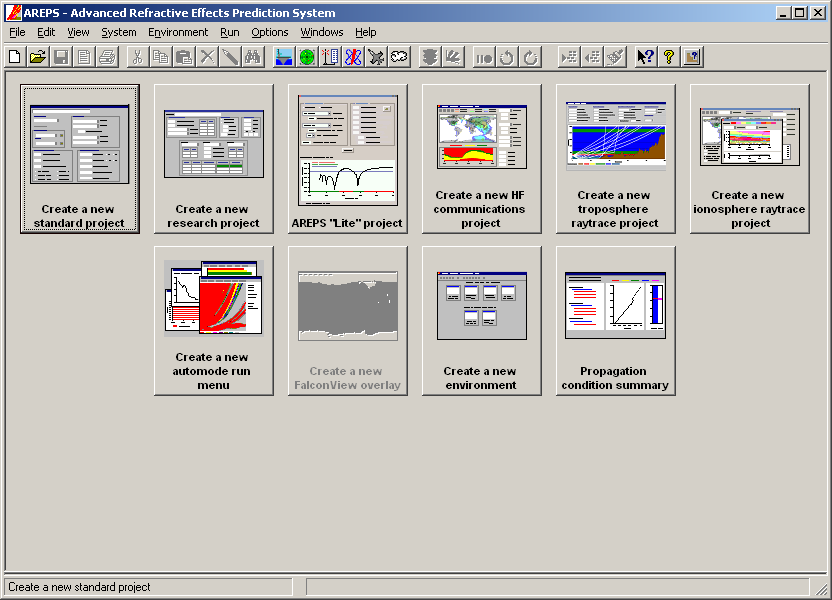
AREPS
The
Advanced Refractive Effects Prediction System (AREPS) program was
developed in 2003 by the Space and Naval Warfare Systems Center of
US NAVY at San Diego. In a military framework, AREPS computes and
displays various electromagnetic system performance in order to
assess tactical decisions. These systems include radar probability
of detection, electronic surveillance measure (ESM) vulnerability,
V/UHF communications, simultaneous radar detection and ESM
vulnerability, and surfacesearch detection ranges.
Divided
in 10 modules, AREPS is functional for all frequencies between 2 MHz
and 57 GHz. In the framework of ham activities most tools are
useless. However two of them deserve your attention : the HF
communication project that displays propagation conditions between
two radio stations and the Ionosphere raytrace that uses the IRI
model. Optionally the Troposphere raytrace project could interest
the few U/SHF users.
About
the HF communication module, from a reduced set of inputs like the
time, the location, the environment, the sunspot number and K-index,
AREPS displays several maps and charts among which the Electric
Field, Received power, S/N ratio, Propagation loss, MUF, FOT and LOF.
Using the mouse, you may display values not mapped (e.g. if you
display the S/N ratio, with the mouse you can display the received
power, propagation loss, etc).
One
constraint, as explained in the manual, the regional settings must
be set to English (USA) or even English (Ireland) for European in
the Euro zone to prevent systematic errors with the comma in
numbers, very annoying.
Now
at version 3.6, AREPS is a freeware. It comes with a complete
online manual, including a big PDF manual of 284 pages (3.17 MB)
very well documented.
Unfortunately,
for some years this program is only available to U.S. DoD military
users (having a valid ".mil" e-mail address). It is no
more available at Navy's Spawar
and the other links are subject to malwares.
For
all Windows 32-bit platforms but ME.
|
|
VK4EMM
Freeware
|
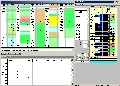
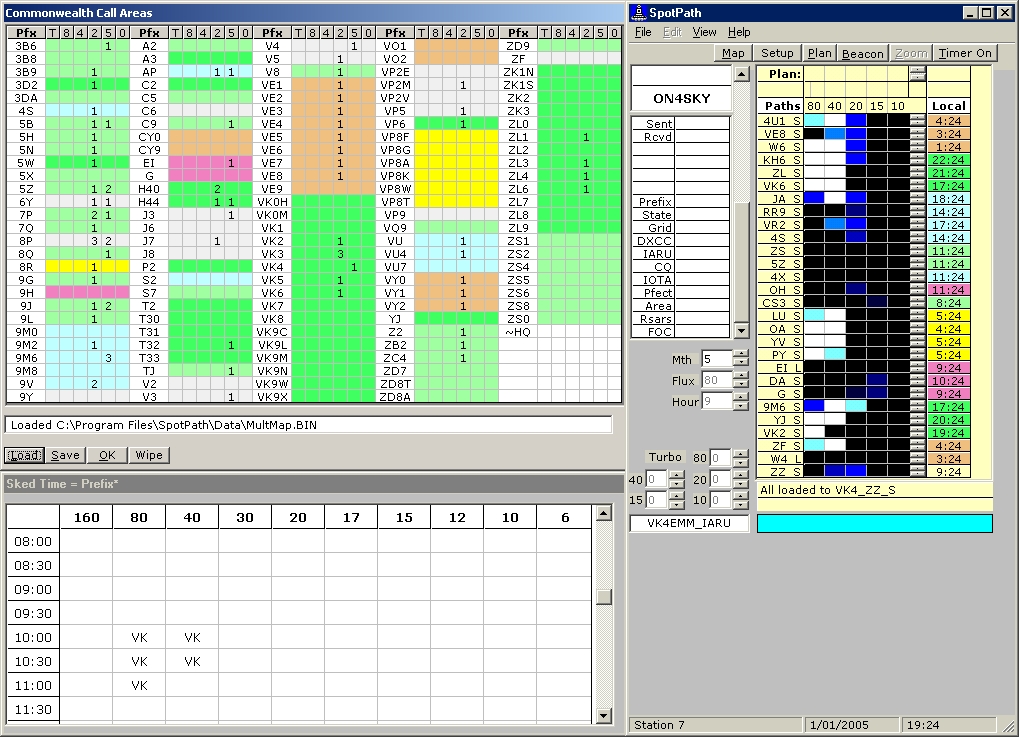
SpotPath
Richard
Loftus, VK4EMM, provides an original propagation software organized around a
propagation table that gives an instant picture of propagation
conditions to 28 regions from your QTH. Like many non-VOACAP
applications, it uses a database made from contests and DX-pedition
results. SpotPath performs all path analysis during the initial
program start-up using pre-compiled datas for your QTH.
After
have entered the right date and solar flux FSI (between 80 and 200),
the main window shows the short path conditions from your station to
any entity. Expected signal strength is represented by the glow or
brilliance of a cell, changing from black (highly unlikely
propagation) to white (best propagation) with four different
intermediate shade of blue (dark, light and cyan). You can see this
way and in a glance propagation openings to a specific DX entity or
to all 28 regions for all five main bands for 24 hours in one-hour
or in half-hour slots.
You
can zoom in the selection by clicking with the mouse in a cell, on
the "zoom" button or using the command line, leading each
command with a dot. For example, to display the propagation to JA,
type "JA.". If your entry is not listed among the 28
predefined regions, SpotPath jumps to the nearest listed location.
Indeed, its database is linked to all 75 ITU and 40 CQ Zones. You
can also search on ITU and CQ zone numbers, as well as on prefixes
In
addition, SpotPath includes a beacon monitor that highlights the
zone in which the NCDXF/IARU beacon is currently active. You can use
this tool to calibrate the propagation table in using a small tool
located below left called Turbo (beam booster). Depending on your
setup, you can change the propagation for all bands to reflect your
real conditions.
>SpotPath
comes also with a planner in which you can keep track of openings
and a status map listing zone multipliers (for contests). It can be
linked to a network version of CT Logging Program to keep track of
zones worked in each band. In this mode SpotPath can send alert and
pop up messages to operators. At last, SpotPath
comes with a short manual in Word format.
SpotPath
is now at version 2.01.12. Freeware for Windows 95, XP and
2003 platforms.
Unfortunately
this program is no more available from Spotpath
nor directly to VK4EMM.
|
|
W6EL
Freeware
|
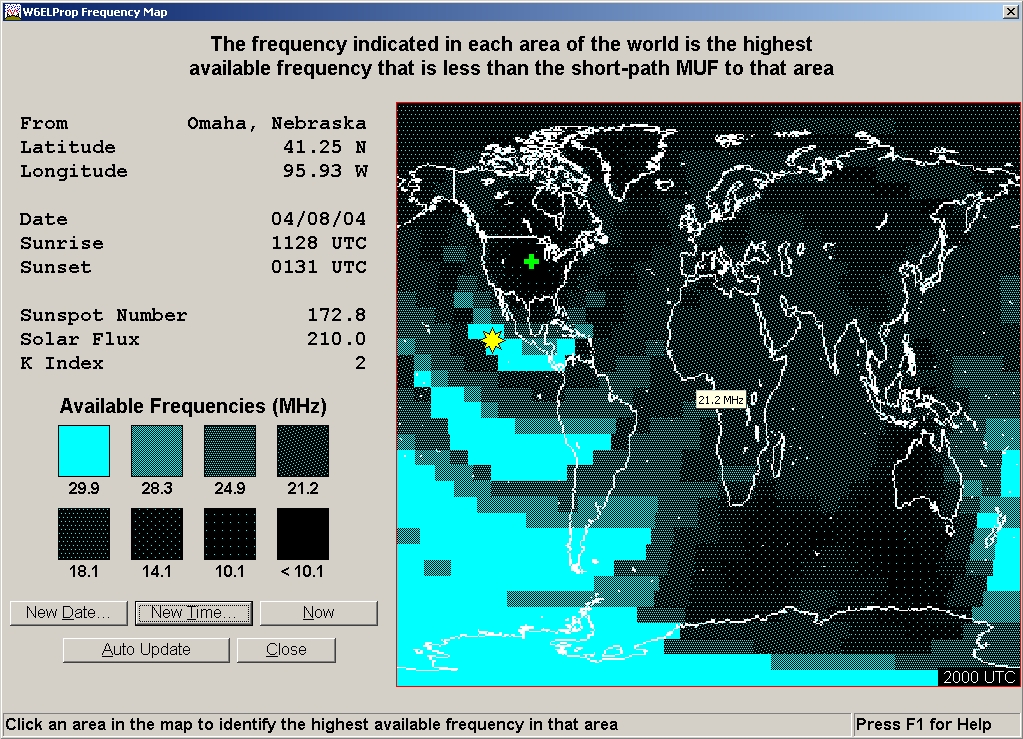
W6ELProp
In
the line of MINIPROP PLUS, Sheldon C. Shallon created in 2001 this ionospheric propagation program that
works under Windows. This point-to-point model take into account a basic communication circuit
and is able to predict the status of the ionosphere on frequencies between 3 and 30
MHz. In input it uses the transmitter and target locations, and supports grid
locator. Its locations are extracted from an atlas. Then the SFI (SSN in
option) and K-index are take into account, as well as the QRM at target location,
noise bandwidth, minimum takeoff angle, and signal level suppression threshold.
W6ELProp uses a better mode-searching algorithm than MINIPROP Plus that takes
into account the D-, E-, and F-layers of the ionosphere to calculate receive signal
strengths. MUF calculations use Raymond Fricker's F-layer method
developped in 1985 combined with the E-layer method developped by
CCIR in 1983.
Results
are displayed under various forms : world maps, charts and tables. The MUF can be
displayed on a global ionospheric map in two resolutions (low with 57 areas or
"high" with 877 areas) or in a graph (frequency vs. time). A gray line map can
also be displayed. Other results related to the signal strength are displayed in tabular
forms (signal strengths in dB above 0.5 mV, S/N ratio, availability, takeoff angle, etc).
The program is still supported but without warranty of reliability, etc.
The menuing could be improved. For example you have to close some
screens (graphs) to be able to access to the main menu and maps, and
you cannot display the graph without requesting a new prediction.
DOS
program written with Delphi. Executable running on Windows 16 or 32 bits with 256 colors minimum. Compatible with Windows ME and XP.
Freeware.
Support reduced to the strict minimum by the author.
|
|

F6GQK
Freeware
(DXProp)
Shareware
(PropHF)
|
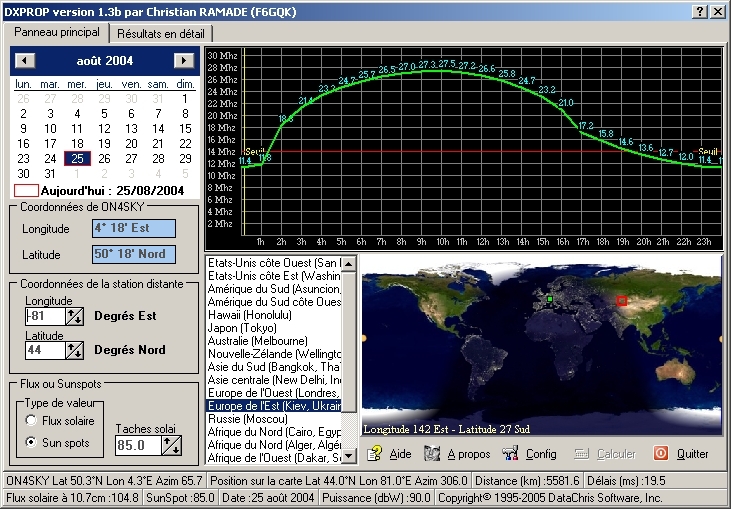
DXProp
/ PropHF
Written
by Christian Ramade, DXProp and PropHF are inspired by David
L. Mills, W3HCF's application written in C language for DOS in
1995. Both applications are available with a French or English
interface to select during the installation process that uses
a complete windows installer from DataChris Software Inc. Both
applications differ only by the screen. There are however some
minors bugs in these layouts. The English interface is either
inop or partly displayed in French and the user callsign is
taken into account only after have closed and rerun the
application.
Both
applications are based on the algorithm used by MINIMUF 3.5
and predict the MUF from the SFI, date and time, the
transmitter and target locations. They offer thus the same
approximations than the NOAA application. The MUF is determined
by hop-testing between the home QTH and the target location until the
radiation angle and the calculation stops in the vicinity of the receiver.
Then, from the emitting power, frequency, and antenna gain
(you have choice between an isotropic, a dipole and a beam),
the ionospheric absorption is calculated, the attenuation and
the delay of propagation. The signal level is fixed to a
sensitivity of -123 dBm (or 0.15 mV
into 50 ohms), common to all modern receivers. The S-meter is
also calibrated at 6 dB per S-unit.
Both
application display all settings in the lower part of the
screen and a grayline map in the lower right part but the
image is a bit too dark. Results, not much, are limited for
DXProp to the point-to-point MUF curve and the signal strength
expressed in dBW for each frequency and time, and for PropHF
to four superposed charts in text mode showing either the
signal strength expressed in dBW concatenated with the number
of hops to the target location, or the takeoff angle, the
delay in milliseconds or the best frequency.
For
all Windows 32-bit platforms.
DXProp
is a freeware but PropHF is a shareware to register with a 20-day-free-trial period.
|
|

IPS
License,
AUD375
|
ASAPS
This
is an australian product developed by IPS. "ASAP" stands for Advanced Stand Alone Prediction System.
It permits to predict propagation conditions at HF but also at low VHF frequencies (1 to 45
MHz) what is rather unusual.
It is based on the ITU-R/CCIR noise
model and is able to creates either point-to-point (field strength)
or area predictions. However, if it looks like a VOACAP interface
it hasn't its power and flexibility yet.
The
kernel is available for Windows 32-bit, Sun, Linux and FreeBSD
platforms.
License,
AUD375. Much too expensive for results in the average. Demo
and tutorial available for Windows 32-bit platforms.
|
|
Pangolin
License,
$40
|
HF-Prop
This
is a New Zealander product written by Mike Harris in 2002, now at version 6 to
not confuse with the old USAF bulletin of the same name and other
homonyms.
From
the home and target location, the solar flux (SFI) and K-index it
predicts the MUF and LUF for the specified path, nothing else, even
the SNR or power at receive is not available.
Results are
displayed in a chart. A world map shows the gray line, the short
path, distance and beam heading to the remote station. In option,
some capital cities can be highlighted. You can also change the QTH
by double clicking anywhere on the map. A central separator permit
to extend or reduce the size of both screens but you cannot get
simultaneously both in full screen. Among the small bugs name for
the chart the title length that exceeds the window, and for the map
some paths remaining when you change of location.
License,
$40. For Windows 95/98/NT/2000/ME/XP. 30-day-free trial.
|
|
Rohde & Schwarz
Freeware
|
PropWiz
Propagation
Wizard, or PropWiz as it is called, takes into account the date (year and month)
solar and geomagnetic indices, transmitter power, transmit and
receive antenna gain, takeoff angle, noise figure at receive,
ground properties, and SNR. All settings and the output are
displayed in the main window that does not provide multi-windowing
capabilities.
Results
are displayed in a chart showing the MUF and S/N margins for
the
specified circuit.
Freeware.
For all Windows 32-bit platforms.
|
|
KY1H
Freeware
|
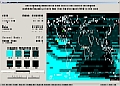
Propagation
Predictor
Written
by David Ribbins, KY1H in 1989 and updated in 1996, "MOF/LOF Contest Propagation tool" as
he prefers to call his program is derived from MINIMUF
for the high bands, and a VOA absorption style predictor for the low
bands. The author also adjusted parameters from real contest data
collected from various locations since 1990. The latest version 2.2
uses A and K indices to take into account disturbed conditions.
Predictions
can be displayed in rectangular, polar or equi-distant projections
at three resolutions but even the highest remains very low for
Windows standards (EGA).
From
a couple of dates the program generates several global propagation
maps showing the MOF or LOF. Maps can be displayed with a step as
short as 1 minute of interval. Of course in this case the initial
calculations last some minutes to calculate all intermediate maps in
the concerned time period. If the delay is too long the program
provides a STOP button to interrupt the calculation and displays maps
already calculated. Each map can also be overlayed with great circle
paths and sun rise position. An auto-playback feature lets you
replay pre-calculated predictions in real time or accelerated time.
When used with the MMPRINT utility provided by the author for the CT
Contest Logging software, MOF/LOF can be used to display the
geographical and frequency band distribution of contacts from actual
contest data. No help function is operational in this version.
Freeware.
For all Windows platforms. A DOS
version is also available.

|
|

Skywave
Tech. Soft.
License, $5
|
IONSOUND
Turbo
This
is the Windows 95/98 version of IONSOUND
HDX. Qualified by the publisher of "very
sophisticated ionospheric propagation prediction program"
(sic!), he provides however no screens
dumps or specification to appreciate this program. As we don't buy a cat in a bag, even
cheap, I was unable to test this product that should
run on all Windows 32-bit platforms.
License, $5 if sent by email.
|
|
|
In
addition, here are some programs dedicated to V/UHF ground
propagation, to name : RFPROP, SPLAT!,
UKW Tools,
Radio Mobile
Deluxe or Ground
Wave Prediction System.
|
Back
to Menu
|


