|

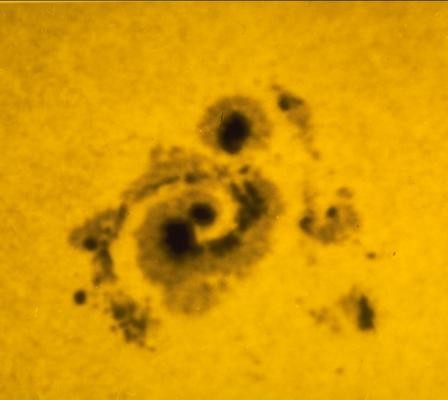
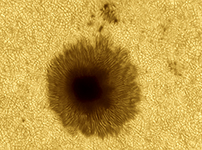
Spiral
sunspot on Feb 19, 1982
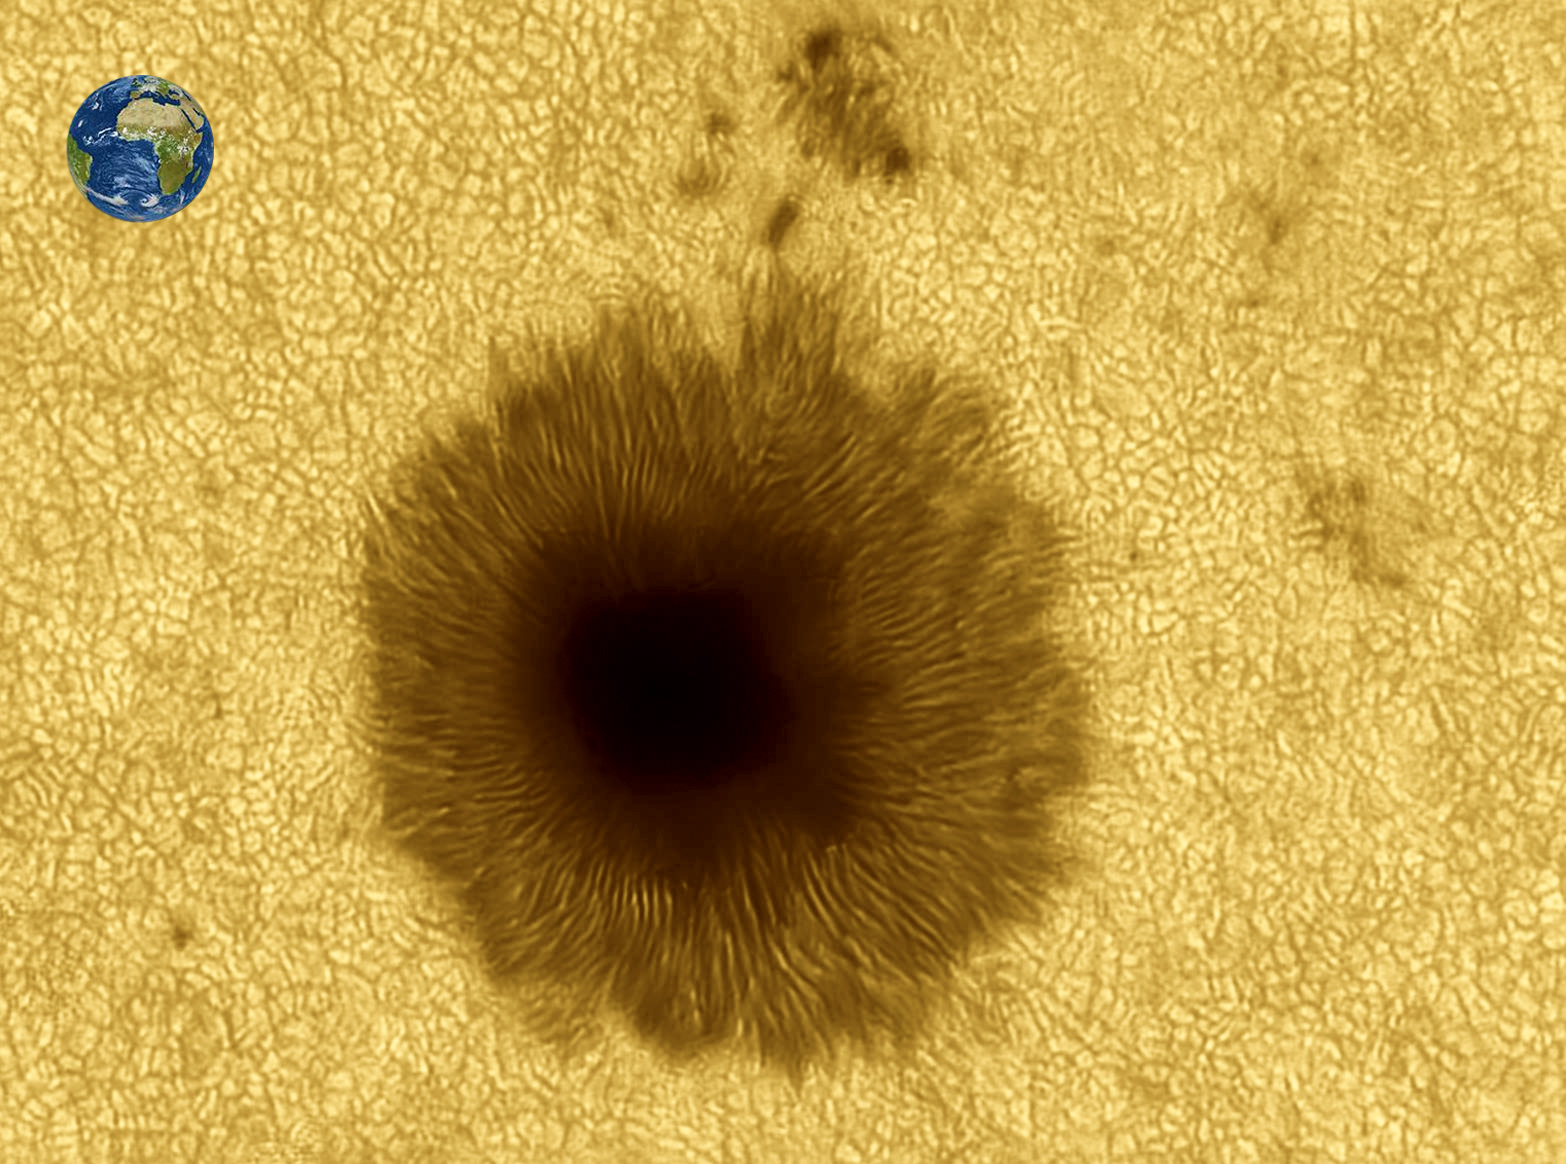
 Sunspot recorded on
May 21, 2016
by
Salvato Giampaolo

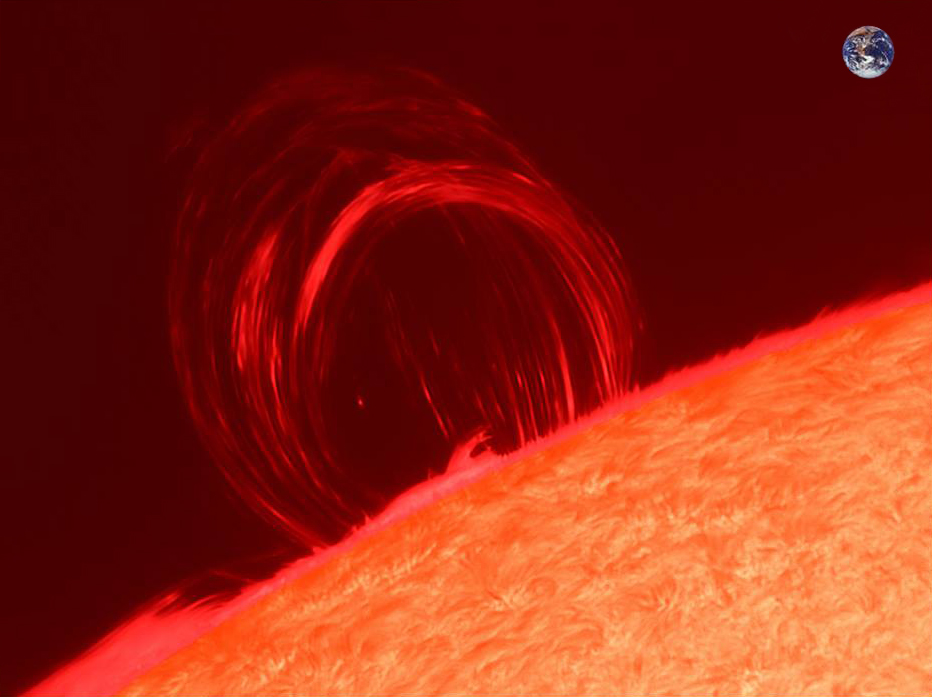
Sun
prominence recorded on July 18, 2012 by Jean-Pierre Brahic. |
SOLAR ACTIVITY
Today
observatories like Sacramento, KPNO, Pic-du-Midi, Swedich Solar
Telescope (SST), Dutch Open Telescope or satellites like SOHO, SDO,
TRACE or Ulysses ensures a permanent monitoring of the Sun activity in all wavelengths of the spectrum.
Others, experts in radioastronomy or elementary physics monitor its radioelectrical emissions.
Neutrino Hits Simulator

Event/mm2
Far
to have the mean to use similar instruments, what can do amateurs ?
Amateurs have much to do if they want their
report be recognized as something else than a pleasant curiosity.
But what happened
on February 19, 1982 suggests that amateurs can still produce scientific
results. That day, for the first time in the history of telescope, we observed a
spiral sunspots group that nobody could explain as you can see at left.
If by a strange
coincidence, the sky should have been cloudy over the majority of
professional observatories (what still occurs in one or another country
from time to time) then the observation of an amateur should have been
greatly appreciated by the solar astronomers. This was the conclusion of
Patrick Siler McIntosh (1940-2016) from Sacramento Peak, the astronomer
who developed the famous sunspot classification of the same name in early
'80s to complete the classical Zurich classification of Brunner.
To complete these
studies, the French association Les Observateurs-Associés du
Pic-du-Midi (OA) are working hand in hand with solar astronomers to ensure a
continous monitoring of the sun corona using the HACO coronograph
installed at Pic-du-Midi in French Pyrénées. This is a real
opportunity for an amateur to pratice both his/her hobby and do a true
long run scientific study of our star.
Now, if you have
the opportunity to use an interferential filter of a short half-bandwidth
(0.4 - 0.7Å) filter and you have time left for monitoring the Sun activity in hydrogen-alpha light,
then you can contribute to some scientific tasks.
For example
you can warn dedicated dispatch centers when you see large prominences or
chromospheric flares in order to forecast auroral activities and
future electrical perturbations on Earth.
Another task consists to
survey the Sun in H-alpha light and make correlations with magnetograms
to forecast disturbances in the solar magnetic field and potential Coronal
Mass Ejection (CME). At last you could discover a sismic event or sungrazers
comets like has done SOHO.
|
FRENCH
PAGES
Sunspot
cycle
SDO
SOHO
SIDC
SONG
SST
ALPO
AAVSO
Dutch
Open Telescope
CV-Helios
Network
GFOES
The
Sun Today
|
|

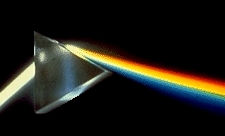
Refraction and dispersion
of white light

Low
resolution Solar spectrum
|
SUN
SPECTRAL STUDY
Among
the numerous applications of spectroscopy, there is the study of the sun
atmosphere, and specially its chromosphere.
We
can observe the sun chromosphere through a spectrohelioscope and record
bright emissions lines that appear, known under the name of
"flash spectrum" (spectre-éclair in french). These events occur during
a total eclipse of the sun, several seconds before and after the phase
of totality while the sun light evolves through the relief of the moon
surface.
At
that time the continuum is no more visible and professional have
identified in such spectra over 3500 lines.
In
this flash spectrum specific to the chromosphere, the helium lines are
very bright although this element be ionized and hard to excite (and
much faint in the photosphere, the Fraunhofer spectrum). You can also
record calcium and hydrogen lines as other ionized metals that do not
appear in the photosphere.
Those
lines are the witnesses of a deep opacity of the chromosphere while we
can see without using any specific method the continuum where the
chromosphere is clear.
The
chromosphere being opaque to those lines, that means all details we
record belong to the chromosphere. This is this peculiar property that
allows manufacturers like Daystar to design high selective
interferential filters so we can explore the sun atmosphere just at the
chromosphere level in the most used lines of H-alpha at 6562.3 Å and Ca-K at 3834 Å.
|
FRENCH
PAGES
NASA-GSFC
Sacramento
Peak
SOHO
GFOES
ALPO
|
|

A
sunspot in H-alpha trichromy
pictured
by Carey Fuller
|
As explained in
the Digital Darkroom pages, beside the usual sun observation in
H-alpha light with an interferential filter,
you can also use it to create dynamic pictures.
Shifting
the filter bandwidth towards the blue and red wings of the H-alpha line
you can create tricolor H-alpha composites. Knowing a 1 Å
Doppler shift in the center of the line represents a moving of 45 km/s
on the sun surface, such tricolor composites will reveal dynamic activity of the
chromosphere much better than a ordinary B/W picture.
Another
application is to map a portion of the spectral line to a region on the
solar surface (professionals use this technique on stars). The blue wing
of the H-alpha line exhibits the portion of the region coming toward us. A sunspot will
therefore first appear as an irregularity in the extreme blue wing of
the line as it come from the sun limb. As it rotates, the event
progresses to the center then to the red wing of the H-alpha line. Using
sophisticated modeling techniques, we can reconstruct the surface
structure from a sequence of spectral observations.

Back
to Reports & Reviews
|
DIGITAL
DARKROOM
|