
This
process is based on Christian Buil's spectrophotometry method, (see part 2 of that
page) although a bit different, because I'm not using flux spectra but
ADU spectra.
It
is possible to derive photometric measurements from a spectrum, in
comparison with the usual glass filter star images, since the light
intensity of the star is still there, simply spread all along the
spectrum. A spectroscope like the Star Analyzer is even well suited for
this because it has no slit. The slit of spectroscopes is selecting only
a part of the light coming from the object, and it is then impossible to
do photometry with it, since photometry supposes to record all the light
(in such a case it is none the less possible to use very wide slits). On
this page I describe my process of building a spectrum suited for
photometry, for the complete range of sensitivity of my camera. This
method is experimental so I will test it over the time.
1)
Processing the spectrum in digital units (ADU)
Usually
spectra are normalized in intensity during the processing because most
of the time the observer do not care about photometry, but we are going
to process them in a pure arithmetic addition.
At
this step, I usually have a few hundreds of raw spectra imaged with
relatively short exposures (never more than 500 ms) because otherwise
the image would get blurred as my current equipment do not track the
object. After alignment and selection, I stack from 150 to 250 raw
spectra under Iris in a simple arithmetic sum, taking care of not
reaching the saturation level of 32767 ADU. This operation allows the
final spectrum to reach a good dynamic, and it also averages the
fluctuations from the turbulence.
To
stack so much spectra without exceeding the max level, the whole series
of images is divided by 100. Here is a screenshot of IRIS of the
addition (see that the normalisation box is unchecked). This is a
spectrum of 200x25 ms spectra of 31 Leonis, a K4III star I have used to
make photometric measurements of R Leonis:
I verify that the max level is under 32767 by looking at the statistics:

Then the spectrum is calibrated in wavelengths under VSpec, because this software is able to take into account the whole flux. For this it is important to adjust visually the spectrum to avoid a too narrow zone of binning that would cut some of the signal:

The same method is used to process a second spectrum taken with an infrared-pass filter, because the second step is the soldering of the visible part and the infrared part:
2) Assembling the complete spectrum
A
spectrum obtained from a Star Analyzer is "pure" from its UV first end
up to a wavelength of around 750 nanometers in the near infrared. At
this point, it begins to mix itself with the UV/blue end of the spectrum
from the second order (a grating is producing an infinity of spectrum,
we just use only one, the brighter, that is the first order). This
prohibits any use of the spectrum in its infrared part, but also to make
photometry in the Johnson red band, since it has a tail well into the
near IR (see
the light curves).
| To overcome this problem, I have decided to work with a rebuilt ADU spectrum containing only the visible part from the spectrum imaged without filter, and the IR part obtained with the IR filter. First, I look for a small wavelength range that the two spectra share where the profile is smooth and parallel (see at right - this is a presentation where the position of each spectra is relative). This star is quite red and so the blue end of the second order is not perceptible. This would be different with a blue star! Here, the common part is from 7170 A to 7190. |  |
| Both spectra are then cut under the ISIS software: from 3000 to 7190 for the visible part, and from 7170 to 11000 for the IR part. Then, they are soldered under VSpec into one: |  |
| Unfortunately,
this operation breaks the original intensity in ADU of the
spectrum, which is then expressed in an arbitrary unit. The last
step will be to: 1)Multiply the full spectrum in order to have it recover the original intensity of the visible part expressed in ADU. The factor is found by dividing the intensity of the ADU spectrum in its highest point by the intensity of the resulting full spectrum at the same wavelength point. 2)And finally, the full spectrum in ADU is multiplied (or divided, depending on the brightness of the target) by a given factor in order to take it to an intensity expressed in one second only. This is an usual practice for spectroscopy and photometry work. For example, here the operation is (remember there are 200 exposures of 25 ms divided by 100): ADU
for 1 second = 0,025 ms / 100 * 200 = 0,05 and then 1
second/0,05 = 20
Here is a comparison with the full spectrum (in red) with the original visible part (in blue) that shows that the original profile is well recovered. This is an experimental method. Would it prove in the future to be inaccurate, it would still be possible to work with the original visible and infrared part. |
 |
3)
Deriving photometric measurements from the spectrum
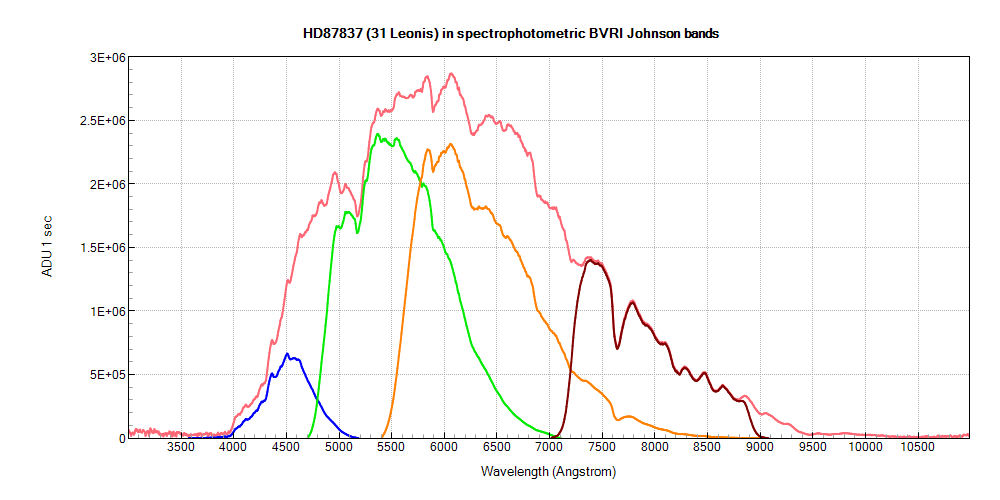
| Finally,
we get a spectrum suitable for photometry. This last operation is
done under ISIS, which allows to calculate the integrated
intensity of a synthetic photometric filter band (refer to
Christian Buil's page above). Here is a graphic showing our star with its photometric bands superimposed. The intensity of each band allows to find the corresponding instrumental magnitude by the formulae b/v/r/i = -2,5 x log(intensity). Then, the instrumental magnitudes can be converted into standard Johnson magnitudes by using the AAVSO method. |
 |