(based on version 3.2.3, Aug. 29, 2020, by Marc Delcroix)
Detect software is the tool to support the impact flashes detection project, aiming at:
- analyzing Jupiter and Saturn videos to look for potential flashes provoked by small bodies impacts
- collecting the results of these analyses wether successful or not (dates, impact found) to estimate the frequency of impacts on the giant planets (which has an impact on refining the age of bodies in this part of the solar system by counting craters on their surface)
- discovering as many impacts as possible to refine the physical characteristics of these impactors (size, composition) as well as the energy and components released int the giant planets' atmosphere
Download latest version of DeTeCt software at the project github repository.
Basic usage
GUI guide
Detection images check tutorial
Multi-instances mode
Basic usage

1. Ensure autoprocessing is checked to have impact detection starting automatically when folder or file is selected
2. Choose folder (all acquisition files with supported format found recursively in this folder will be selected for impact detection), or directly a single file
3. Check detection images and send results: 3 windows will be opened:
- an explorer where are the detection images to be checked (see tutorial for help) :

- an explorer where is the zip file to send to the project :

- an email, you should attach the zip file to it (by drag and drop for example) before sending it to delcroix.marc at free.fr

4. - gives you the number of potential impacts detected on all files processed, according to their probability (Null, Low or High)
GUI guide

Detection images check tutorial
Detection images are generated
in a folder named "Impact_detection_run@rundate_runtime". There is one
"dtc_mean.jpg" image, mean of the aligned acquisition images, and a
"dtc_max-mean.jpg" image where each pixel is its maximum brightness minus its mean brightness of all frames.
This "max-mean" image aim is to show any transient bright phenomena. A blue cross will show the brightest point in this detection image, and potentially a yellow cross showing the area where the differential photometry algorithm identified a potential impact flash.
Additionaly in the GUI, and in detect log, you will find a rating (Null, Low or High) measuring the probability of an impact, followed when relevant by a frame number corresponding when this possible event is visible. Examples: Null ; Low ; HIGH (@ 3231). For the high probability impacts, you have also a confidence number, the higher the better.
You need to look at those images, to see visually if there is anything suspect for you. With a bit of experience, you will do that in one or two seconds, you have below some examples to help you interpret those images.
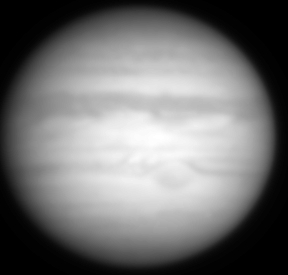
| Explantion | dtc_max-mean.jpg "detection image" |
dtc_mean.jpg image |
| 2019-08-07 impact discovered by Ethan Chappel thanks to DeTeCt Detection is obvious, both crosses are centered around a bright patch in max-mean image, while nothing special is identified in the mean image at this location. Confidence/Rating = 8.3875 HIGH (@ 9282) |
 |
 |
2016-03-17 impact observed by John Mc Keon Detection is obvious allthough on the limb. Both crosses are centered around a bright patch in max-mean image, while nothing special is identified in the mean image at this location. Confidence/Rating: 14.0570 HIGH (@ 1167) |

|

|
| 2017-05-26 impact discovered by Sauveur Pedranghelu The differential photometry algorithm did not detect the impact properly (no yellow cross). Nonetheless the brightest point in the image looks quite suspicous, it is spread over a few pixel, with some less bright pixels around. Nothing is seen at this area in the mean image. Here the direct analysis of the video proves that a flash was captured. Confidence/Rating: 0.0000 Low |

|

|
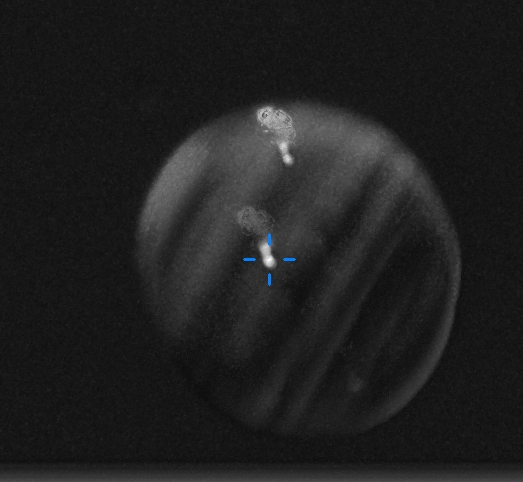
| 2010-08-20 impact observed by Kazuo Aoki The differential photometry algorithm did not detect the impact properly (no yellow cross). Furthermore, the brightest point of the detection image is not the impact flash (located a bit left and below the center of the planet), but on Ganymede on the top left corner of the image (as seen in the mean image) Confidence/Rating: 0.0000 Low |

|

|
| Satellite shadow transit The slow move of the shadow of Io on Jupiter globe hide a part of the planet which then appears bright in the max - mean detection image. No impact here. Confidence/Rating: 0.0000 Null |
 |
 |
| Bright pixel(s) The differential photometry algorithm did not detect anything (no yellow cross). The brightest part of the detection image is pnly a couple of fully saturated pixels, looking really artificial. A careful look at the video show that this is due to bright pixels only present on a couple of frames. This is due either to temporary hot pixels, or a cosmic ray event. No impact here. Confidence/Rating: 0.0000 Low |

|

|
| Dust mole The differential photometry algorithm did not detect anything (no yellow cross). There are strange bright circles on the detection images, looking at the mean image reason is obvious: two dust moles, at different places due to the move of the planet on the sensor, are present. They hide part of the planet, for which the substraction of the mean image to the max imagemakes them bright. No impact here. Confidence/Rating: 0.0000 Low |
|

|
| Artifact The differential photometry algorithm did not detect anything (no yellow cross). The brightest part is detected in the detection image is "pixellized", on the limb where several bright areas appear in this kind of image, when alignment or seeing is not so good. This has no real explanation, this is only an artifact generated during processing. No impact here. Confidence/Rating: 0.0000 Low |

|

|
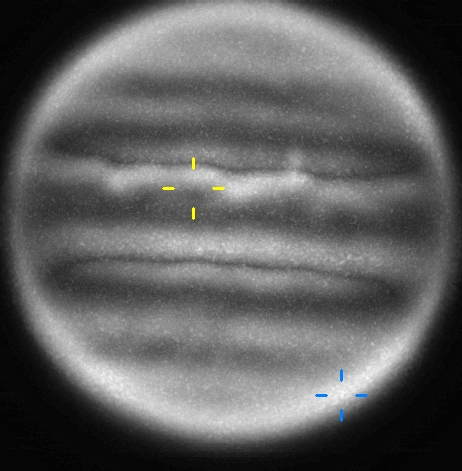
| No outstanding bright area The differential photometry algorithm detected something not obviously spread and birght, same for the brightest part of the image. Both are totally separated. No detection was made here, rating is Null. No impact here. Confidence/Rating: 1.4782 Null |
|

|
| No outstanding bright area The differential photometry algorithm did not detect anything (no yellow cross). The brightest part is detected in the detection image is "pixellized", where several bright areas appear in this area (NEB). There is no real explanation, this is only an artifact generated during processing, rating is Null. No impact here. Confidence/Rating: 0.0000 Null |

|

|
| Dark zone generating pixellized bright area The differential photometry algorithm did not detect anything (no yellow cross). The brightest part is detected in the detection image is well spread but really "pixellized", at a place where very dark feaston lies in the mean image. The seeing/alignment probably made probably this dark zone move, generating a bright area in the detection image. A careful look ar the original video did not show anything suspect, and , rating is Null. No impact here. Confidence/Rating: 0.0000 Null |

|

|
| Bright area in the rings In this Saturn acquisition, both the differential photometry algorithm and the brightest area in detection image are a close match. But this is in the rings, between brighter B ring and darker C ring, where turbulence moved the appareance from bright to dark. Looking at the original video around the frame specified, nothing suspect was found. No impact here. Confidence/Rating: 0.4497 Low (@ 915) |

|

|
As a conclusion, after running detect:
- always check the detection images using this tutorial, to interpret the detection image and see if you have discovered an impact.
For that you can open the first image in the "Impact_detection_run@rundate_runtime" folder in your acquisition folder, analyze it and click right arrow to see the other ones
- focus on "high" and "low" probability detections
- in case of doubt, check the mean image, the ephemeris for a transiting satellite or shadow, have a deeper look at your original video (AutoStakkert! or SER Player can read the acquisitions frame by frame).
If a frame number was specified in the log file, have a deeper look around that place in the acquisition video.
- always send the generated zip file to delcroix.marc at free.fr, we will have another look at your images
- even if you found nothing, always send the generated zip file to delcroix.marc at free.fr, no detection matters and has high value to help us to estimate the frequency of impacts on Jupiter and Saturn
- do not erase your videos till you got an acknowledgment from me that we had a look at your results.
Precious scientific studies were made by analyzing the lightcurves of impact flashes discovered/observed by amateur astronomers.
- If you are lucky enoough to detect an impact, please inform me. Send your files generated by DeTeCt, and make your acquisition file available.
Prepare also for a temporary celibrity, once announced to all international amateur community, medias, web sites, the pros will contact your to get more info, this is everything I wish for you!
Happy impact hunting!
Performance and multi-instances mode
Starting with v3.2.3, DeTeCt
supports a multi-instance mode, aiming at reducing the total processing
time. While the software does not process a single acquisition file
with several parallel threads to take advantage of multi-processors
CPUs, it can launch several instances of itself to process in parallel
several acquisition files. Principle is to have a parent instance, the
first one launched, both processing files and collecting the results of
hidden instances (with no graphical user interface displayed).
The absolute maximum number of instances is fixed to the number of processors (physical or virtual) of your machine, but you can choose the maximum number of instances you want to have with the corresponding arrows in the GUI top right corner. Then detect will run as many instances needed to process all selected files, respecting the maximum number your defined. For example let's imagine you have a 12 core machines, you choose a maximum number of 9 instances, and select a folder with 24 files to process. The software will initially launch 8 additionnal instances to have 9 in total processing the files. Once 16 files has been processed, there will be only 8 total instances running to process the 8 files left, then 7, etc. down to the last one.
Selecting this maximum number of instances might be a bit tricky has it depends on your configuration. Here are tests results on my configuration (i7 12 cores, 24GB RAM) :
On a normal 7200rpm hard drive (HD):

We can see that with 3
instances running in parallel, we have a 37% gain in processing time.
Then the time reduces a bit more, to increase again a bit when more
than 8 processors are used. Looking at hard drive and processor usage
with windows task manager, I could see that with one instance running,
the HD is used at 15% capacity while the processor used at maximum
capacity, and with 4 instances, the HD and the 4 processors are used
close to maximum capacity. Increasing after the number of processors
makes each instance use less than the maximum processor capacity while
the hard drive does its best despite being the limiting factor.
Starting at 7 instances, the hard drive access from so many instances
makes the total computing time increase again.
In that case, I consider the optimum number of instances is 4 : the best processing time with the lowest number of instances (to avoid too many HD parallel access which put strains on the hardware).
The computing time is here 1.7x faster with 4 instances.
In that case, I consider the optimum number of instances is 4 : the best processing time with the lowest number of instances (to avoid too many HD parallel access which put strains on the hardware).
The computing time is here 1.7x faster with 4 instances.
On a Solid State Drive (SSD):

In a case of having the
acquistion files stored on a SSD, read write access is not a limiting
factor: even with the maximum of instances running, the SSD usages
peaks only at 15% usage. Nonetheless above 9
instances used, the total computing time do not decrease: computing power is the limiting factor.
In that case I consider that 9 instances is the optimimum number of instances to use, the rest of the computing power being used by the operating system and other applications running.
The computing time is here 5.7x faster with 9 instances !
In that case I consider that 9 instances is the optimimum number of instances to use, the rest of the computing power being used by the operating system and other applications running.
The computing time is here 5.7x faster with 9 instances !
Some additional tips:
- you can reduce a bit (5 to
10%) computing time by activating the save of session files in
autostakkert (menu advanced->Save
sessions next to each stack): then DeTeCt will use the alignment
information the session files store, to avoid realigning all frames.
- you can dynamically reduce or increase the maximum number of instances, in case you need more power for other tasks, or on the contrary you want to use as much computing power as possible for impact detection. Beware though, the number of running instances only changes slowly, decreasing when an instance has finished computing an acquisition file, or increasing after several seconds when the parent instance checks for changes in the number of instances.
- you can dynamically reduce or increase the maximum number of instances, in case you need more power for other tasks, or on the contrary you want to use as much computing power as possible for impact detection. Beware though, the number of running instances only changes slowly, decreasing when an instance has finished computing an acquisition file, or increasing after several seconds when the parent instance checks for changes in the number of instances.