by Christian Buil
The Solar Explorer - October 25, 2023
by Christian Buil
The Solar Explorer - October 25, 2023
Observation

Part 1: immersion
Before we get into the details and tips of how to use Sol'Ex in writing, what better way than with a quick immersion into the world of this device. It will cost you just 30 minutes of your time to get into the swing of things, so you can tackle the rest in full knowledge of the facts:

But that's not all. To convince you even more of Sol'Ex's ease of use and discover its many possibilities, take a look at these two other videos which describe how to use it on a simple photographic stand for a "minute" start-up:


Of course, you can't expect the same quality as that obtained from the focus of a fine telescope, but this strikingly simple and elegant way of using Sol'Ex is already producing quite respectable results.
Part 2: Select the imager instrument
Because of its principle and the shooting method ("spectroheliograph" mode), the focal length should preferably be between 200 and 1200 mm. Below a focal length of 200 mm, the smallness of the image of the sun disk at the focus prevents obtaining a very detailed view. Above 1200 mm of focal length, the image delivered is very detailed, but the time exposure must be reduced, which induces an increase in noise. The volume of data acquired also rises very quickly, the slightest scan can reach 2 GB or more (size of the SER file), a situation which becomes easily unmanageable in the long run (unless you resign yourself to scan only restricted areas of the disc).
The focal length of the imaging device should not exceed 420-450mm to capture the image of the sun disk in a single scan pass (a "scan", see "Theory" section). Above, you can perfectly take images, but you will only have a fraction of the disk, which in itself is not at all prohibitive, and will oblige to assemble the result of several "scans" in a single image under desire a global view, which takes a little more work.
As a general rule, telescope using mirror optics cannot be fine with Sol'Ex. It remains the astronomical glasses and the photographic objectives (telephoto lenses). The ideal aperture ratio (focal length to diameter ratio) for Sol'Ex is between 6 and 10.
The views below show a number of associations with Sol’Ex:

Mounted on a photographic tripod. Lens with 25 mm effective diameter and 180 mm focal length in "Sunscan" configuration (the natural diurnal rotation of the Earth on its axis is responsible for the scranning - see part 1 of this page).


200 mm telephoto lens


Canon de 400 mm téléphoto lens + 2x extender (800 mm final focal length)
TS refractor, 65 mm for the diameter, 420 mm for the focal length.
EVOGUIDE SkyWatcher refractor, D=50 mm, F=232 mm.

Astrograph FSQ85ED Takahashi (F = 450 mm)
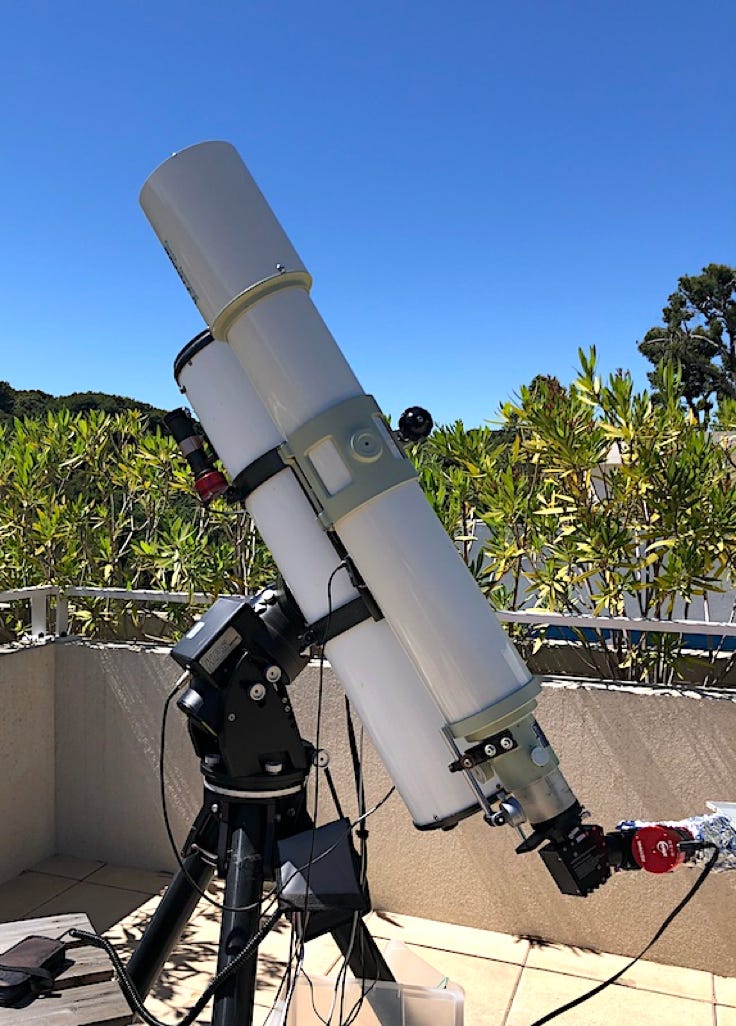
FS128 Takahashi (D=128 mm, F=1040 mm).
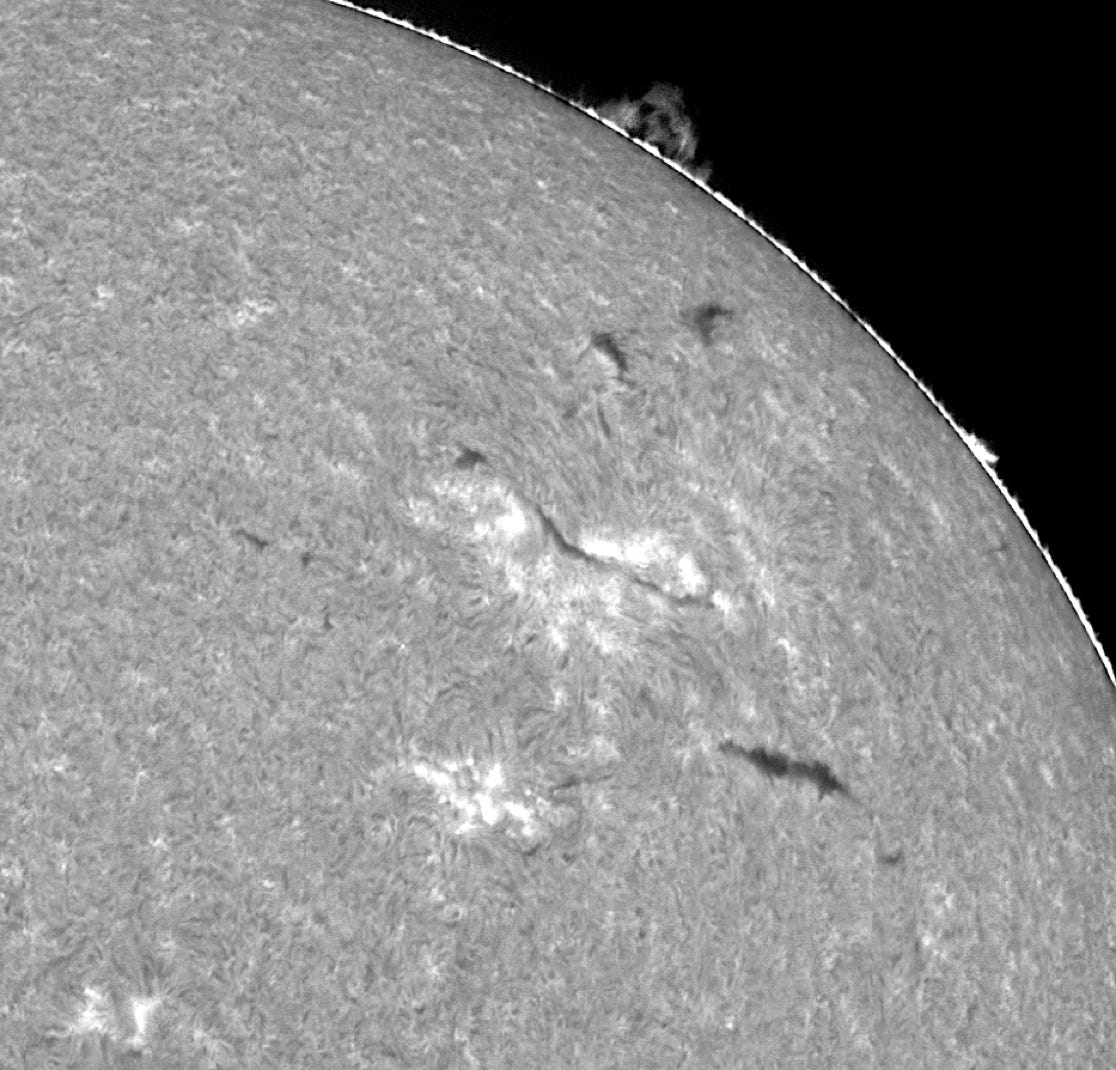
The two pictures below taken with Sol'Ex illustrate the aspect of the solar disk in the H-alpha line for the two extreme configuration of this enumeration:
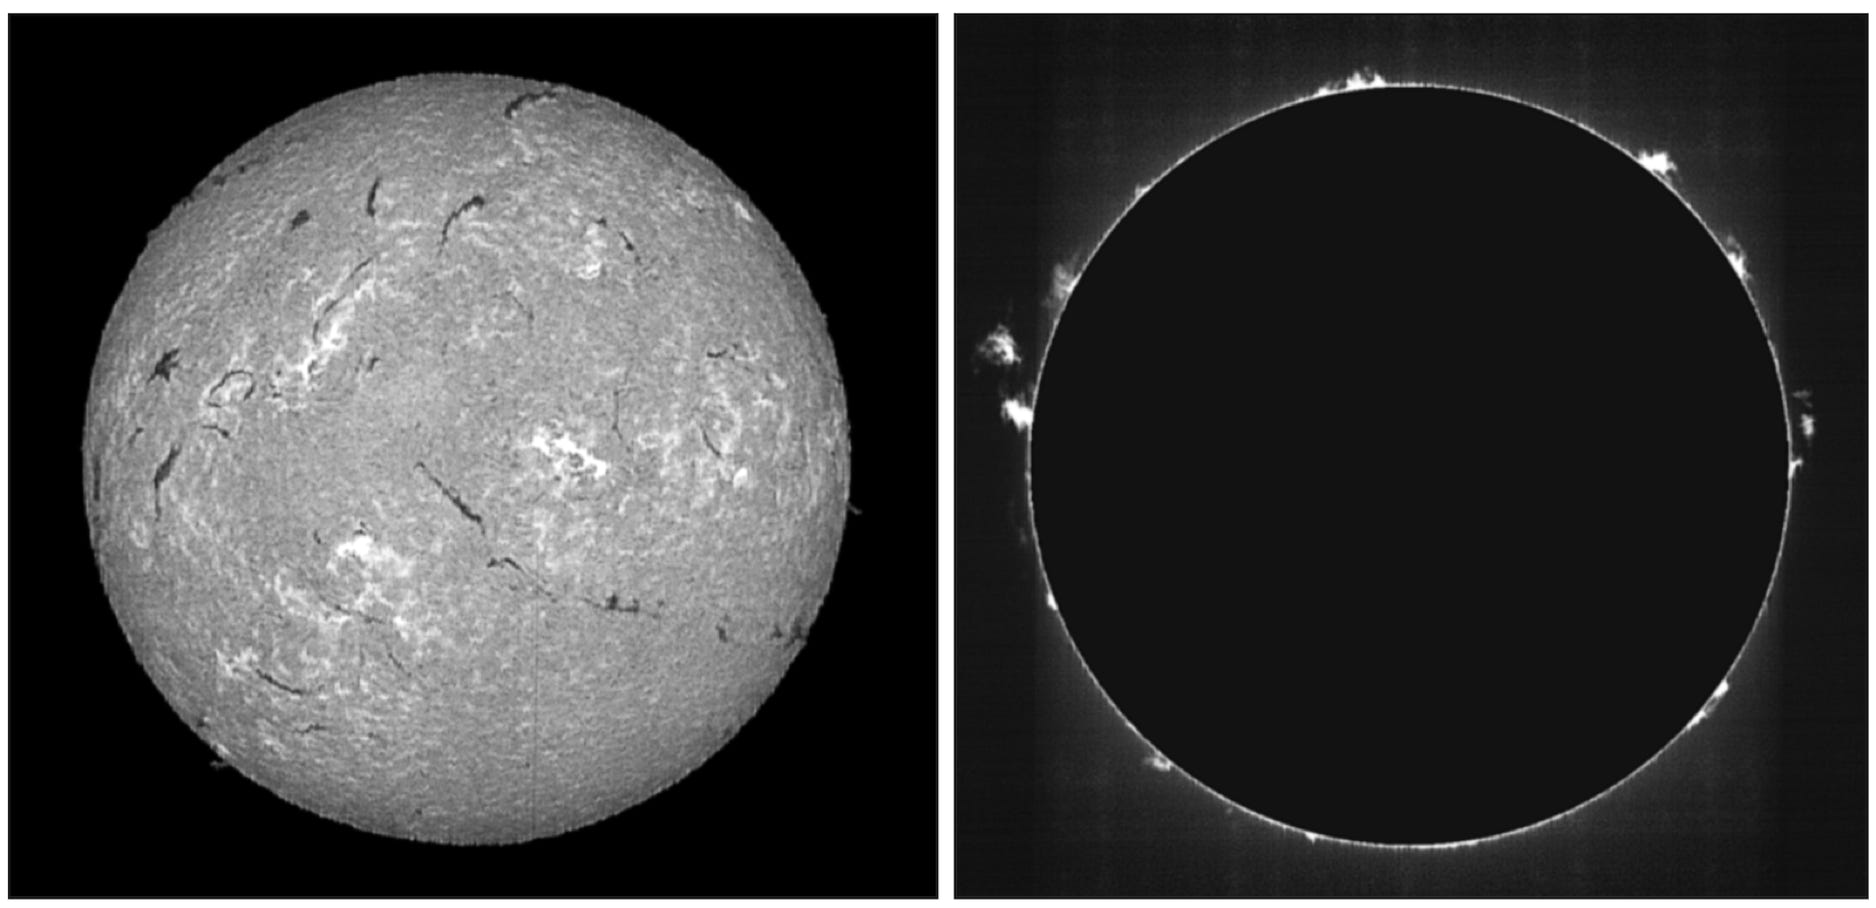
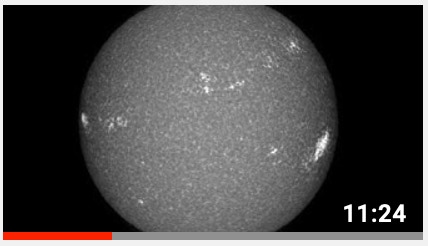
Image taken in Sunscan mode on a photographic stand, with the disk moving naturally at the entrance to the slit (October 4, 2023). The lens used is a SkyWatcher 50 mm diameter, 180 focal length, stopped to 25 mm diameter only. This easy-to-use and quickly set-up configuration is ideal for animations, for learning Sol'Ex and for enjoying a brief moment of clear sky.

Image taken with an FS128 refractor (1040mm focal length). The configuration is much heavier, but reveals fine details if the degree of atmospheric turbulence allows it.

Simultaneous observation of the Sun with two Sol'Ex, one operated in the foreground by Valérie Desnoux at the focus of a 120 mm AstroPhysics refractor, the other operated in the background by the author at the focus of a 128 mm Takahashi refractor.
There is, however, an exception to the use of telescopes when they are of small diameter. The following example shows the use of Sol’Ex on an Acuter educational Maksutov telescope, with a diameter of 60 mm and a focal length of 750 mm. An attenuator filter is mandatory at the front of the telescope to avoid melting the plastic parts that make it up - see discussion about neutral density filters below (part 5). This configuration is remarkable in more than one way: (1) the purchase price of this type of optical tube is very low (100 euros), (2) the quality is really good, because the optics are quite closed (f/12.5) and its very correct realization, (3) the whole (telescope and Sol'Ex fully equipped with its camera) does not weigh more than 1 kg, which means that it can be installed on small mount or easily transported when traveling, (4) far from being a gadget or a toy, it is an "all" plastic solution very consistent with Sol'Ex, attractive by the performance obtained, whereas it is difficult to get cheaper to observe the Sun, at home, in a school, etc.

On the right, the image of the Sun taken on November 26, 2021 in the H-alpha line with a 100 euro optical tube (MaksyGO Acuter). A neutral density (ND4) filter at the front of the tube is mandatory and completes the set (see part 5).


The relatively long focal length (750mm) does not allow to capture the entire disc image with Sol’Ex in a single scan. The images above, corresponding to this single scan, were taken with the ACUTER telescope on December 3, 2021, left, in the red hydrogen line, right in the K-line of Ca II. It is of course always possible to make a mosaic of the northern and southern hemispheres to build a global disc.
Click on the image on the right to view a film (English version) showing in a very concrete way the use of Star’Ex on this small telescope.
You can download here the STL files of a possible interface between Sol’Ex et le télescope Maksutov ACUTER 60mm telescope. This interface is made in two parts and has a housing for a 31.75mm filter.


The quality of the focusing system is essential to obtain sharp images of the Sun. Positioning of the Sol'Ex entry slit to within +/- 0.010 mm is sometimes necessary, or even better. Adding a measuring device is very useful, such as a mechanic's micrometric probe (a dial gauge). This element is fixed to the body of the telescope, and the measurement is made in relation to the mobile part which supports Sol'Ex via a gauge. Many economical models exist, mechanical or digital (I like the mechanical needle, because more readable in all positions).
Focusing with a photographic lens requires skill. If the mechanics are generally very good (helical system without clearance for the right material), on the other hand, you need a helping hand to succeed and ideally have a direct view of the acquisition screen to judge the result in real time (see a video later on this).
To estimate the correct focus of the image of the Sun on the Sol’Ex slit when acquiring the "scans", you have at least three criteria:


(1) the sharp edges at the end of slit image.
(2) a jagged H-alpha line structure, which changes quickly as you scroll the disc across the slit. This structure reflects the variations in gas velocity in the chromosphere that Sol'Ex can perfectly detect (Doppler-Fizeau effect).
(3) if a sun spot is present on the disc and you have centered it on the slit, the black line that it forms all along the dispersion axis is all the more contrasted the better the image is focused.
This procedure is concretely explained in a video that you can view by clicking on the following image:

Note that the capture is always done by orienting the camera so that the dispersion axis is vertical (parallel to the columns of the detector), and therefore the horizontal lines. This arrangement greatly optimizes the CMOS reading frequency.
A question arises as to the orientation of Sol'Ex relative to the the telescope mount, in order to either perform a scan in right ascension or in declination. There are several schools, but mine is to scan in right ascension, without a shadow of a doubt. This is more natural (this is what you are led to if you scan with the telescope's drive motor off). Often the mechanical quality of the mounts and the motorization is of better quality in right ascension compared to the declination axis. If you only capture fractions of the solar disk in one pass, because the focal length of the telescope is long, it also makes astrophysical sense to work along an axis close to the equatorial plane of the solar disk, with the equatorial belt often being the richest. in detail.

Aspect of the chromosphere when the slit tangents the solar edge. If you do right ascension scan - which is recommended - the observed solar point is quite close to the solar equator.
Part 3: The camera
Aside from the refractor (or telephoto), the main financial investment in using Sol’Ex is purchasing the shooting camera if you don't already have one. I broached the subject of the camera in part 4 of the "Construction" section.
I just recall that a small pixel CMOS camera is generally preferable, like the ASI178MM (2.4 micron pixels, ideal) or the ASI2890MM / Mini (2.9 micron pixels). If you own a ZWO ASI174MM camera (or the equivalent from QHY), don't worry, you can use it; you will get beautiful images of the Sun despite a pixel size of 5.86 microns, without spending a penny, and knowing that small pixel models are quite often used with 2x2 (software) binning.
On the other hand, I do not recommend the use of color cameras, if it is not for an educational purpose (showing the spectrum in color always does its little effect!).
For the camera to operate at high speed - frequencies above 100 frames per second are often necessary - you must have a computer with a USB3 interface. It is mandatory, but it is also the standard today! In addition, the link between the camera and the computer will be short and direct, without going through a HUB, which does not generally provide the required reading frequency. Another key point is the windowing of the image in its useful area which frames the spectral line used to produce the image of the Sun (the « « cropping »). It is important that the camera is oriented so that the spectral lines are horizontal in the images, for reading at the maximum speed of the sensor taking into account the internal architecture of the latter. In this case, the cropping zone is much wider than it is high. The width generally includes the total width of the the slit image. For example, with an ASI178MM camera, the windowing is 3088 pixels in X and 140 pixels in Y, ie crop = 3088x140.
In normal operation, during solar scans, the gain of the camera must not exceed 200 (in the ZWO frame of reference, equivalent to 20 dB). Above the noise becomes very visible. A gain of 100 is perfect, and a lower gain is even better. This gain is adjusted according to the exposure time - see next section.

Part 4: The mount
We know that the principle of observation consists in letting the image of the Sun scroll in front of the slit while making regular acquisitions at high speed, so as to correctly sample the solar disk over time, with good regularity. The images thus acquired are saved in a single SER file
An equatorial mount is a practical way of guaranteeing orthogonality between the direction of scrolling and the long axis of the slit, and thus facilitating the use of the instrument. In other words, the image of the disk viewed through the telescope or refractor moves here at right angles to the long axis of the Sol'Ex slit. It is recommended to respect this perpendicularity to better than 1 degree for comfortable use of the Sol'Ex and for certain advanced applications that require good geometric corrections of the disk image (magnetogram, ...). This means you need to orientate Sol'Ex correctly in relation to the telescope and its mount (see the videos below). Make sure you mark your bearings when mounting and dismounting Sol'Ex from the camera.
I also recommend performing the scan along the right ascension axis (not the declination), (1) for astrophysical reasons (Doppler measurements, see below), (2) because the scan is often more regular in right ascension, (3) because it is more logical and natural.
The scrolling speed of the disc image on the slit has a significant impact on the quality of the images obtained and the comfort of use. A "natural" scroll, at sidereal speed (15°/hour) corresponds to a stop of the drive motor in right ascension. It is quite possible to do so, but the scan from east to west (or vice versa) of the entire solar disk takes more than 2 minutes. This affects interactivity, and if the average movement is by definition very regular, on the other hand the agitation of the images caused by atmospheric turbulence is clearly felt over such a long time. If you have a mount that allows track speeds of 8X, 16X...sidereal speed, the scan will be much faster and there is a better chance of falling into a hole in the turbulence. The scan is then said to be "forced". Here, the camera must be able to acquire images at high speed (several hundred images per second) in order to obtain an almost circular disc of the Sun, without having to make very significant retouching. For more information on this point, see the "Processing" section of this site.
To obtain an almost round disc the first time, it is necessary to choose a good coupling between the selected forced scan speed (4x, 8x, 16x…) and exposure time for each frame constituting the scan, the size of the pixels of the camera and the focal length of the refractor.
- if V is the multiple of the sidereal speed adopted (V = 4, 8, 16…);
- if t is the exposure time, in seconds;
- if p is the size of the camera pixels (after binning), in microns;
- if F is the telescope focal length, in millimeters
- if delta is the declination of the Sun at the time of the observation,
Then the exposure time t to adopt to obtain a round disc is given by the formula:
t = (8.79 . p) / (F . V . cos(delta))
Let's take an example. We use a refractor with a focal length of 420 mm (F = 420), with Star'Ex equipped with an ASI178MM camera operated in 2x2 binning, i.e. a pixel size of 2 x 2.4 microns = 4.8 microns (p = 4.8). We decide to scan the solar disk at 16x the sidereal speed (V = 16). At the time of the observation, the equatorial declination of the Sun was 23.42° (delta = 23.42) (for an expeditious calculation, you can make delta = 0°). After calculation we find:
t = (8.79 . p) / (F . V . cos(delta)) = (8.79 x 4.8) / (420 . 16 . cos(23.42)) = 0.00684 second
That is therefore 6.84 ms. This is the exposure time to be displayed in your acquisition software used to generate a SER file, from which the image of the Sun will be calculated. This exposure time corresponds to an image frequency of 1/0.00684 = 146 frames per second. You must check that the acquisition software (SharpCap, FireCapture, etc.) is capable of reading the video stream from the camera at this rate. If you have defined the acquisition window, as indicated in the previous part, there should be no difficulty (the image must circumscribe the spectral line of interest and no more). Simultaneously, once the exposure time has been set, also adjust the gain of the camera so as not to saturate the continuum close to the spectral line (in general).
It is not certain that your speed V is exactly that displayed, or that the declination of the Sun is not taken into account. You must therefore check, from the calculated value, the precise exposure time to obtain a very round disc after a quick processing.
Proof of the previous formula. Let E be the detector pixel size in arc seconds projected on the sky (spatial axis of the spectrograph, see also in the "Theory" section of the site the formula, giving the quantity Vy):
E = (206 p / F) x 80 / 125 (E in arcsec with the units previously used, and 80/125 the collimator/objective lens focal length ratio)
In addition, the angular displacement E' of the Sun in arcsec for a given time t (in seconds) toward the pointed direction on the sky is given by the classic formula (synodic rotation of the Earth, i.e. 360° in 24h):
E' = 15 . V. t. cos(delta)
For the solar disk to be round, it is necessary that E = E', from where by approaching the corresponding equations, the equation we use is find for the exposure time.
Be careful, at high scanning speed, some frames are victims of oscillation (resonant phenomenon) which have a dramatic effect on the quality of solar images. The result depends on the catching direction (east or west) and the balance of the mount. Check the smoothness, the regularity of the solar edge (apart from the turbulence) to make sure everything is fine. If necessary, choose the best scanning direction (from east to west or vice versa).


At the top, the balancing is such that it generates clearly visible oscillations on the solar limb when scanning the disk at 4X sidereal speed with an FS128 telescope. At the bottom, the mount is balanced differently and the oscillations have completely disappeared. The image of the Sun presented is the result of processing a Sol'Ex acquisition outside of any line, which produces a classic view of the solar photosphere,
However, the use of Sol'Ex on an ordinary photographic stand fitted with a ball-and-socket joint is by no means out of the question. This exploits the Earth's natural rotation on its axis. The result is a lightweight system that's easy to transport - for travel, for example - and, last but not least, easy to use and play with. Of course, there's no longer any question of the disc running perpendicular to the slit, but this is considered acceptable for images taken on the go, all the more so as processing software such as INTI are very good at correcting the geometric distortions resulting from this mode of use, known as "Sunscan". The reasonable maximum focal length of the telescope used to image the Sun is 200 mm, so you shouldn't expect very detailed views, but they do reveal the full range of solar activity available to Sol'Ex. See part 1 of this page for links to videos explaining Sunscan mode.
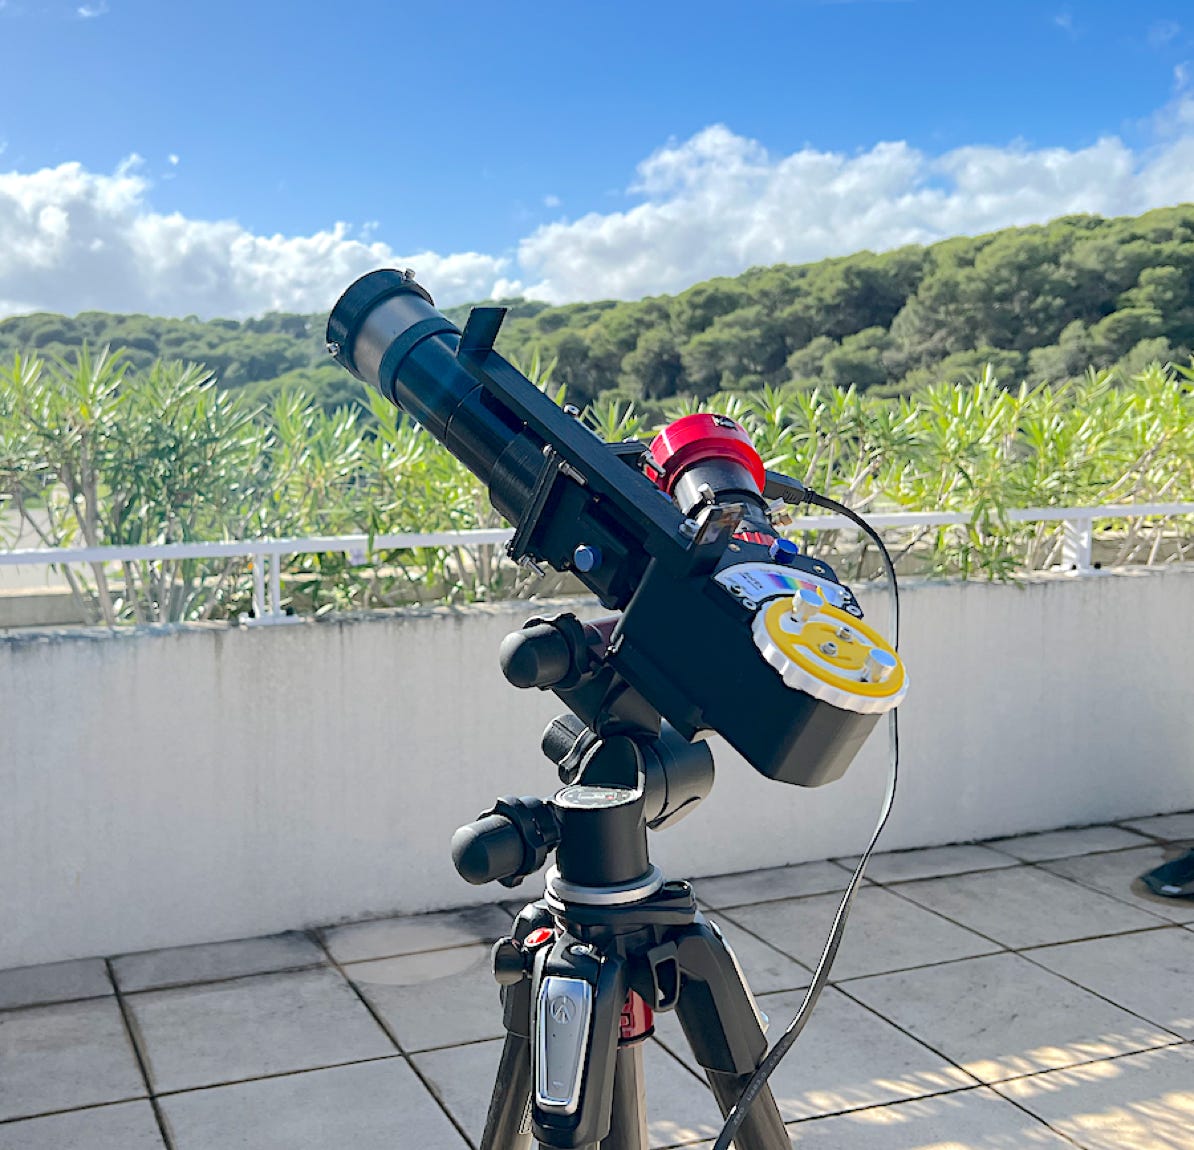
Sol'Ex operated in Sunscan mode. A high-performance three-axis photographic support is used for maximum comfort. You can also build your own Alt-Az mount to perform the same function (in the "mini Dobson" spirit, for example).
Part 4: Sol’Ex thermal protection

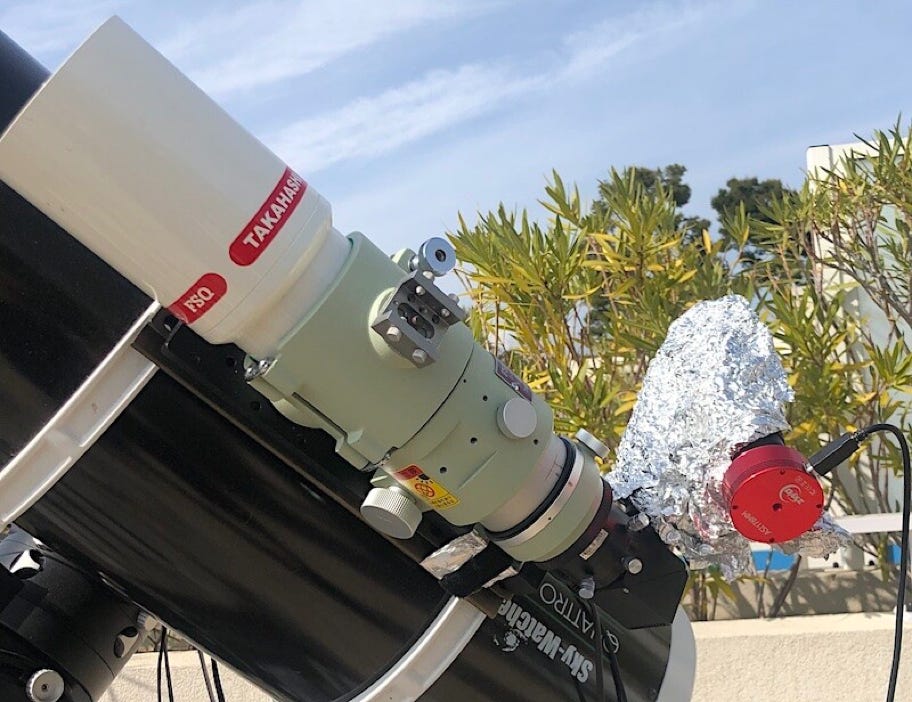
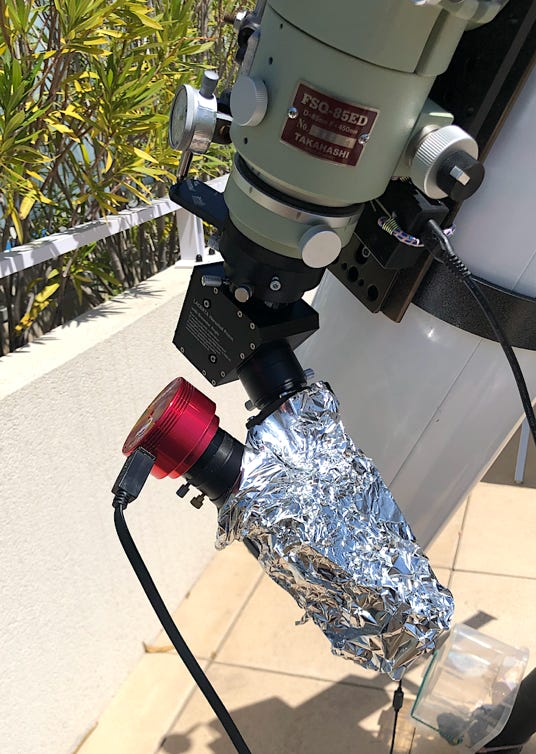
If you use Sol’Ex as shown in the photograph to the right, you are exposing a black case to the Sun, and the temperature will rise very quickly. This causes thermo-elastic deformations of the plastic from which Sol'Ex is made, with the visible effect of more or less random shifts of the spectrum in the plane of the sensor. It is not possible to work this way, as conditions may have changed during scan!
It is therefore imperative (I stress the term "imperative") to keep Sol’Ex at a temperature close to room temperature, which means interposing a screen between the Sun and Sol’Ex. I use a really simple technique, to the detriment of aesthetics, effective, which does not weigh down Sol'Ex and which does not add wind resistance: wrap Sol'Ex in kitchen aluminum foil ( use the double-layered model to limit tearing problems). This is what the image on the left shows…. guaranteed effective!

Opposite, aluminum foil protection against temperature rise when Sol’Ex is mounted on the focus of a Takahashi FSQ85ED telescope.
Part 6: Filter the solar flux
The shooting instrument (refractor or photographic lens) concentrates a strong energy at the focus in a small area. The temperature is high there if you do not use an element that absorbs or reflects this energy. It is precisely here that the Sol'Ex entrance slit is positioned, a very thin glass blade covered with chrome (inclined at 30° relative to the optical axis), a material that is both reflective and absorbant, on which is drawn the pattern of the slit (a transparent line 4.5 mm long and 10 microns wide). The glass is glued to another piece, made of aluminum, serving as a support. Both of these can withstand the energy contained in the focused image of the Sun, but the differential expansion between glass and metal can lead to mechanical stress and breakage. This is what you see in the image opposite; a slit that is broken because it is subjected to intense focused solar radiation for a long time and without any attenuation.
It is therefore important to attenuate the solar flux to a certain extent to secure the operation of the instrument. To verify that there is sufficient attenuation, place the palm of your hand in the focus of your telescope. If you can hold your hand for at least 15-20 seconds, you can assume that it will be okay while using Sol'Ex.
The simplest solution to reducing the intensity of the solar flux is to position a neutral absorbent filter at the entrance of the refractor or photographic lens. Filters are available from HOYA or B + W brands with various densities at fairly reasonable prices up to a diameter of 82 mm. The correct density values for us range between 0.6 and 1.2 depending on the instrument used. For example, with a 400 mm telephoto lens used at f/5.6 associated with a focal doubler (final aperture at f / 11.2 - see the films below) I use a particularly clear filter, of density 0.6. On the other hand with a 200 mm lens at f / 5.6 the value is ND = 1.2
HOYA offers a larger density staging than B + W. In addition, after various tests, the surfacing quality of the HOYA filters is such that it does not degrade the quality of the images delivered by Sol'Ex, which is essential. The HOYA filters are also less expensive and do not present fringe phenomenon, which is not the case with the B + W filters tested, which is troublesome. In summary, the right source is the HOYA PROND filter series.


Many diameters are available, corresponding to the standards of photographic lenses: D = 62 mm, 67 mm, 77 mm, 82 mm… You choose the one that best corresponds to the diameter of your refractor/telescope, but allow a margin of 2 to 5 mm in addition.
On the right, the fringe system observed with the neutral filters B + W. This is absent on the HOYA PROND12 filter, recommended in most situations, and only slightly visible on the ND8 or ND4 models, the latter two can be used when the optical flux is lacking.
These filters, designed for photography or cinema, of course easily adapt to all photographic lenses. For a telescope, it will be necessary to manufacture an interface in 3D printing (for example) - see opposite. You can download from the following links the corresponding STL files (compressed files), as examples for some popular refractors and telescopes:
- Interface for D=67mm filter on a Takahashi FS60 refractor: click here
- interface for a D=77mm filter on a SkyWatcher 72ED refractor: click here
- interface for a D=77mm filter on Maksutov Acuter 60 mm: click here


These density photographic filters are effective over a wide wavelength range, certainly for the visible, but also for the infrared. In case of doubt, you can add an infrared cut-off filter (IR-cut) screwed onto the 31.75 mm interface - but not necessary with the filters indicated. For information, solar energy below 400 nm represents 3% of the total energy, between 400 and 700 nm we find 42% of the total energy, between 700 and 1100 nm we have 34% of the total, between 1100 and 1700 nm, 15% of the total, and beyond to infrared, 6%. The exact proportion depends on atmospheric transmission, but we can see that the infrared part, not visible to the naked eye, is not negligible.
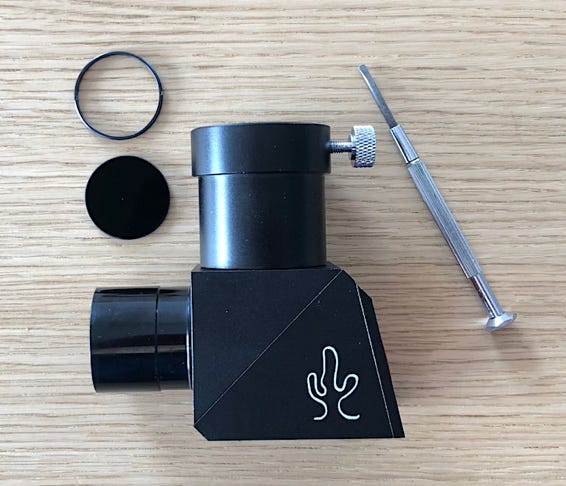
The other way to filter the intense solar flux is to use a Hershel helioscope, an accessory well known to solar observers. This looks like a telescope 90° folder. The principle is simple: the solar flux captured by the telescope meets a little in front of the focus a strip of bare glass (without surface treatment), most often inclined at 45°. Naturally, a bare glass surface reflects about 5% of the incident flux and transmits the rest, or 95% (the internal absorption of the glass is almost zero). The subsequent attenuation eliminates any risk of material breakage as a result of the helioscope (but viewing with the naked eye without further filtering is still prohibited). The second side of the blade forms an angle with the first in such a way as to avoid the appearance of a ghost image.
The following photograph shows some helioscopes available on the market for 31.75 mm interface:


After evaluation, the use of the TS model turns out to be disappointing in the specific context of the Sol'Ex application, a particularly absorbing polarizing treatment on the glass causing the whole to lose a lot of luminosity, to the point that it happens that there is a lack of light in certain cases, which is a shame when observing the Sun (the TS helioscope behaves like a density of approximately 1.8). The LUNT, HERCULE, or even BAADER models, which use an untreated blade, however, do the job perfectly. The LACERTA model exploits an untreated blade at a particular angle of incidence, known as Brewster, which maximizes the linear polarization induced by this blade. This property, and the fact that Sol'Ex itself polarizes the light, to more than 75% in the red (it is the diffraction grating which is responsible), that the overall transmission is maximized, which is turns out to be an advantage. Despite its massive side and high optical draw that will not fit all scopes (make sure you can focus), the LACERTA is the ideal helioscope for use with Sol'Ex. How to operate a helioscope will be explained in a video, the link of which will be given a little further on.
Occasionally, a neutral density filter is fitted in the helioscope when it is delivered (see right). If this is the case, this filter must be removed, along with any polarizing filter offered by the manufacturer.
The photographs below show how to orient the Hershel helioscope in relation to the frame (in the case of a right ascension scan, the most common) and how to orient Sol'Ex in relation to the helioscope. The way to put these elements together is not intuitive, but it is crucial to respect it. The origin of this arrangement is linked to the joint polarization of the helioscope and Sol'Ex, in order to maximize the optical flux transmitted in the system.


Here is a tip regarding filters to improve the quality of the images. Note that its implementation is completely optional, because Sol'Ex delivers good images as is. The idea is to reduce the level of the parasitic background when we observe protuberances in the solar limb. If you have such an accessory, add a 5 to 10 nanometers wide H-alpha band-pass filter to the front of the slit, usually used to aid in viewing gaseous nebulae in the sky. In doing so, by adding a pre-filter, the parasitic instrumental diffusion is reduced. The idea is of course only valid for the H-alpha line.


On the left, the installation of a narrow bandwidth H-alpha filter at the entrance to Sol’Ex. Above, the appearance of the spectrum in the area of the H-alpha line when a bandpass filter is used: only light from the near neighbor of the line enters the spectrograph, which reduces internal scattering.


The aspect of the Sun on November 16, 2021, obtained with a TS refractor 65 mm in diameter and 420 mm in focal length, and by adding an Astrodon bandpass filter of 5 nanometers (50 A) bandwidth at the input by Sol'Ex. The sky background at the limb then becomes very dark and homogeneous, which improves the visibility of the weakest protuberances.
One last remark to close this part. The glass slit is mounted on a piece of black anodized aluminum. This metal part absorbs more heat than the glass part. To make sure that the temperature does not rise when observing with a large instrument, you can make this absorbent part of the slit holder reflective by placing strips of aluminum tape on the affected parts, as shown in the photograph. on the right (but above all, do not stick anything on the glass part!).

Part 7: Observation by using 200 mm telephoto objective and a neutral density filter
To get started with Sol’Ex do not hesitate to use a modest instrument, this is the best school. For example, in the videos that will follow, I will show you how to use a simple 200 mm photographic lens of 200 mm, already allowing to obtain interesting and demonstrative images of the solar surface in the red line of hydrogen (H -alpha), but also many other lines.
The videos in this section show the basics of what you need to know to use Sol'Ex.
In the first one below (click on the image), I explain step by step how to mount the lens in question on Sol’Ex, how to use a density filter, how to approach the focus of the disc, etc:

The following video shows how to prepare Sol'Ex for the actual observation, by addressing the subjects of pointing the Sun, focusing the spectrum, focusing the solar image (see also part 1 of this page) and the orientation of the instrument:

The last video in this section shows how to perform a scan, how to use the SharpCap capture software, and how to use the INTI software for fast scan processing and solar disk visualization:

Part 8: Observation by using 800 mm telephoto lens and neutral density
In this part I describe how to use an objective with a larger focal length. This is a 400mm telephoto lens combined with a focal extender (doubler). The images produced by this system are much more detailed (but do not show the whole disc in one pass):
The following video, how to use these setup :
Part 9: How to use a Hershel helioscope
The following video explains how to set up a Hershel helioscope associated with a telescope 65 mm in diameter and 420 mm in focal length. In particular, we stress the important question of the Sol'Ex orientation in relation to the helioscope:

Partie 10: How to observe solar spots
Certainly, Sol'Ex does a great job of delivering images of the Sun with light coming from narrow spectral lines, but don't forget that you can also perfectly generate an image of the photosphere and sunspots, by using the light of the spectral continuum. The following video (click on the image), shows how to do this, in particular using the INTI software:

Part 11: The impact of binning and focal length
The operation of binning consists of agglomerating adjacent pixels to form a single one. For example, 2x2 binning groups together the signal of the pixels forming a square with two pixels on each side. With CMOS sensors, binning is achieved by a simple arithmetic sum, which is less efficient than with CCD sensors which perform analog summation. Software like SharpCap offers this possibility of binning on acquisition.
For us, the purpose of binning is threefold. First, some reduction in noise upon viewing. Then, a very significant reduction in the size of the files. At constant scanning speed, the volume of a SER file acquired in 1x1 binning is 8 times larger than a file acquired in 2x2 binning, which is a considerable difference.
Conversely, 1x1 binning samples the spectrum and the solar disk more finely (along the spatial axis) than 2x2 binning. So the picture, is potentially more resolved. For example, the two images of protuberances below were taken in continuity with 2x2 binning and 1x1 binning (scaled afterwards):

Takahashi FSQ85ED - binning 2x2.

Takahashi FSQ85ED - binning 1x1.
Careful examination of these images actually shows a gain in resolution using 1x1 binning. The theory of Sol’Ex is well verified. But we must put this gain in relation to the size of the images, which degrades the flexibility of use and interactivity.
Be careful, 2x2 binning degrades the spectral resolution compared to 1x1 binning. If you need to make precise measurements on the spectrum or work on very fine lines, 1x1 binning is essential.
The other lever to increase the sharpness of the images is to use a bigger shooting instrument, which more focal length, of course the cost of the operation is much higher than the simple fact of choosing the binning factor, but the performance climbs much faster; as shown in the following video:

Partie 12: Observation of H & K lines (Ca II)
One of the interests of Sol’Ex is to deliver images of the Sun in the spectral line of its choice, without having to buy a specialized filter for it. It suffices to select this line by turning the grating wheel. Here are some examples of images at various wavelengths taken with a small telescope:

In this part we will focus on ionized calcium (Ca II) lines located in the ultraviolet (UV). They are easy to recognize because they are very wide.
But two difficulties arise. First in the UV the signal decreases rapidly in strength. Often, it will be necessary to push the gain of the camera to see the details. Then, the chromaticism of the optics (that of the telescope, and especially of Sol'Ex) becomes severe. This last point requires certain manipulations: refocusing of the spectrum on the detector to find very fine lines in the image of the spectrum, refocusing of the telescope to have a sharp image of the disc on the slit. The following video discusses these topics and delivers some tips:
A question addressed in this video is the choice of the line, the so-called K line or the so-called H line. On the astrophysical level, they are equivalent. Traditionally; the K line is preferred because it is well isolated, as shown in the spectrum below with a slit tangent to the solar limb. The H line is interesting however, because it is located in a more intense part of the recorded spectrum, but unfortunately polluted by the neighboring H-epsilon line. When observing with the 2400 lines / mm grating, the spectral resolution is sufficient to separate these two lines well during processing, and therefore my preference is more on the H line, which offers less noisy images.
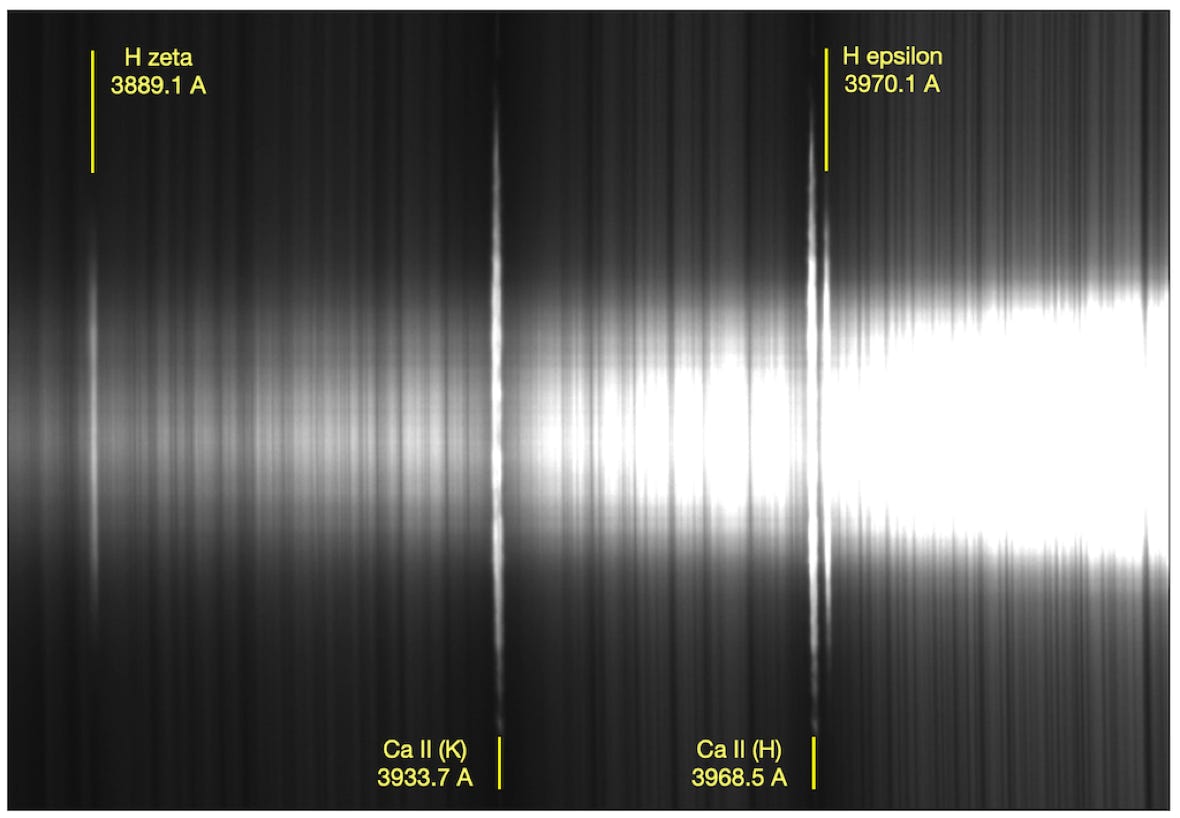
Inversion phenomenon of H and K lines at the solar limb, but also of neighboring hydrogen lines. Image taken with the 2400 lines / mm grating of the basic version of Sol’Ex.
Part 12: Observation of D3 helium line (D3)
It may happen that the spectral lines with which we want to produce a spectroheliogram are almost invisible in the continuum. It's a complication. The typical case is that of the yellow line of helium (He I) at the wavelength of 5875.65 A, called the D3 line. Its intensity is only on the order of 1% of the intensity of the continuum. Suffice to say that she is discreet. To see it properly, it is necessary to observe very close to the solar limb, where it is revealed as a "bright" line in the vicinity of the famous sodium doublet, lines D1 and D2, respectively at wavelengths of 5889.97 A and 5895.94 A:

The images made in the light of helium are particular, with a contrast often reversed compared to what one sees in the H-alpha, and also reveal many other details (note, the yellow coloring is artificial):

It is not possible to obtain an image of this type directly. The method consists in subtracting from an image of the disc produced in the light of the D3 line another image taken in the light of the continuum. The procedure is illustrated by the following video (click in the image to display the film):

Note: Helium was discovered in sunlight on August 18, 1868 by astronomer Jules Janssen. Using the same technique, we invite you to relive this beautiful discovery
Part 14: The Doppler-Fizeau effect
The deformations of the red H-alpha line of hydrogen along the slit are the manifestation of the Doppler-Fizeau effect:

Depending on whether the light-emitting material approaches or moves away from the observation point, the line shifts towards blue or towards red. The result is spectacular, because we have a way to measure a field of (radial) velocities on the surface of the Sun using the core of the line or these two edges. At the same time, we probe the atmosphere of the Sun in its thickness: the light emitted in the wing of the H-alpha line coming from regions deeper than that coming from the heart. In the example below, which concerns an active area around a spot (use of an FS128 telescope) we see a filament appear when we move 0.876 A from the center of the line (it is invisible if we use the light from the core of the hydrogen line):

The other example below focuses on a filament (a protuberance). When we move about 5 A from the line, we reach the photospheric surface, and we no longer see the protuberances and the chromospheric structure (that of the solar atmosphere):

The images shifted spectrally, in addition and in less, compared to the center of the H-alpha lines (or others) can be associated to achieve a colored composition, as below (observation dated May 26, 2021, by using a Takahashi FS128 refractor):

Below is another colorful composition of images synthesized from the red and blue wings of the H-alpha line. Depending on the color, red or blue, the material moves away or approaches us. We synthesize such a color document by attributing to the red calculation the image taken in the blue wing of the line, to the blue channel, the image taken in the red wing, to the green channel, the average of the two previous images:

It is even possible, thanks to the Doppler effect, to measure the rotation of the Sun on itself, following the same principle, the east and west parts approaching or moving away from the observer, hence a shift spectral differential between the opposite edges in the vicinity of the equator:

Part 15: How to observe the hot corona (« E » corona)
Being able to observe the corona outside of total eclipses is a real challenge, quite mythical to be honest. I suggest you carry out this observation with Sol'Ex, accessible as soon as you are methodical.
This observation is deemed by specialists to be very difficult, and even impossible if you do not have the purity of a high mountain sky. Our biggest enemy is not indeed the instrument, but the diffusion of the atmosphere by the aerosols, which prevents seeing the very faint glow of the corona. In reality, the Sol'Ex principle is an asset, the spectrograph being a very effective natural filter, which makes it possible to isolate the coronal emission lines, as would a very narrow filter (Lyot filter for example), while by increasing the contrasts by spectral dilution of the background light. But we are not here in a totally obvious observation, because we must understand that we will have to detect a signal coming from an emission line representing approximately five thousand millionths of the brightness of the disc only!
We are interested in the image of the corona that we see in the light of spectral lines associated with atoms highly ionized by the enormous heat that reigns in the corona. In the example taken, we use the green emission line from Fe XIV (iron atoms ionized 13 times!), located at the wavelength of 5303 A. This state of ionization is reached when the temperature is about 2 million degrees.
For the date of July 5, 2022, the following document makes it possible to compare on the left, an image produced by the SDO satellite instrument, from the Fe XII line located in the ultraviolet, and on the right, the Sol'Ex image for the same date using the green Fe XIV coronal line:
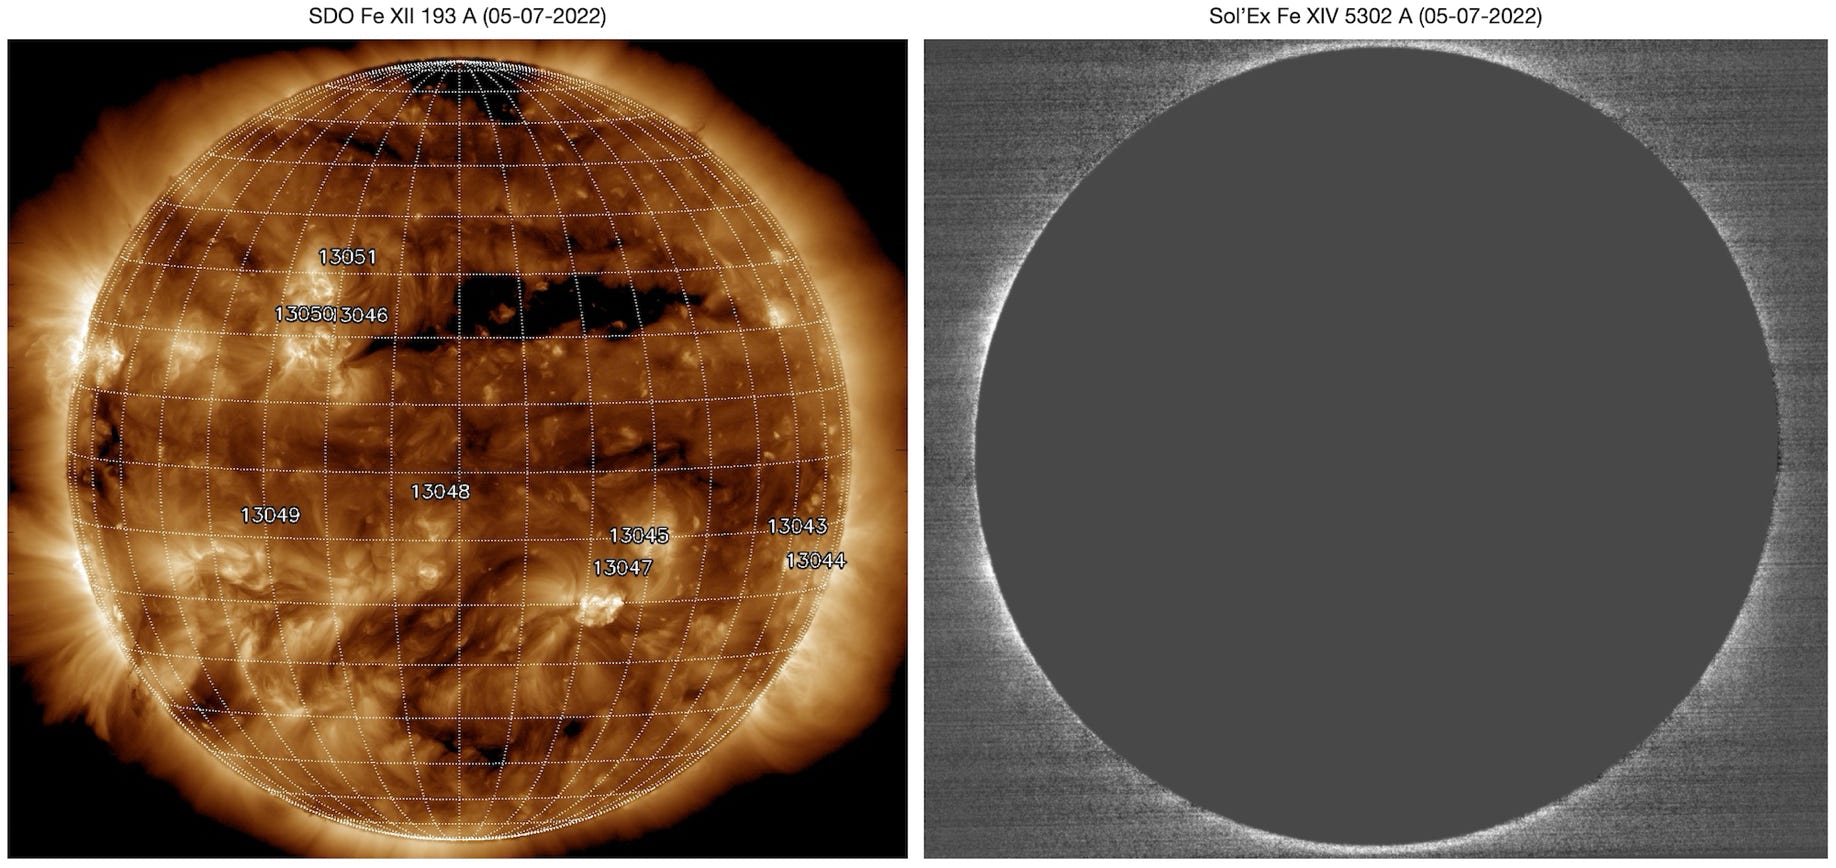
The strong correlation between these two documents indicates that corona detection is effective with Sol’Ex. Only the very low corona (say "E" because illuminated by emission lines) is therefore observed here with the latter, but it is already a gratifying success, while solar activity was quite modest that day. The sky was not really coronal at the time of this shot, from a see level observatory - Antibes city, south of France (a coronal sky is very dark blue), The Sol'Ex used is a basic model, with only the addition at the front of a pre- broadband filter (wide V band, approximately 900 A, from a BVR system):

Installation of a pre-filter on the 31.75 mm Sol’Ex slider, here an Astrodon V-band interference filter, which helps to slightly reduce instrumental optical scattering.
You can consider using a pre-filter that is spectrally narrower for greater efficiency (without this being decisive), but then you must have a filter tuned to the wavelength of the line of interest. It is sometimes possible to adapt, as below, a Baader filter called "Solar Continuum" 10 nm wide, centered on the wavelength of 540 nm at the base, but which is tilted here 25°, which has the effect of bringing the transmission band centered on the 530 nm wavelength:

Diversion of a filter centered natively on the wavelength of 540 nm to lead it centered at the wavelength of interest, here 530 nm, by a simple tilt of 25° in the optical beam at the front by Sol'Ex.
Taking into account the focal length of the refractor used (TS Apo Photoline with a diameter of 80 mm, focal length 480 mm) and the date, the exposure time is chosen to be 5.45 milliseconds (to have a round image of the solar disk from the start ). With the ND16 density (HOYA ND pro brand), the gain with an ASI178MM camera operated in 2x2 binning is chosen to be around 100 (10 dB) so as not to saturate the continuum. However, for the actual observation of the corona, the gain is raised to 300 (30 dB), thus deliberately saturating the image of the disc and thus better distinguishing the sky background. Also, don't use too high camera gain (45 dB…) because it is useless in terms of signal to noise ratio, and you will burn the image where the corona is the most intense (at the limb level). The Sol’Ex image presented is the result of a sum of 9 consecutive scans of the disk, with careful refocusing on the contour of the disk. It is important to note that I used the camera (ASI178MM) in 2x2 binning in order to reduce the volume of the images, while having sufficient spectral resolution and a good signal-to-noise ratio. The acquisition is carried out with the SharpCap software from a window (crop) of 3088x180 native pixels (i.e. 1544x90 pixels after binning). The frame rate is around 180 fps.
The most difficult thing is surely to identify the region of the spectrum where the coronal line is located, then to position it in the scanning sub-window (scan). Here is the location of the most interesting coronal lines for us (our green Fe XIV line at 5302.86 A, and the red Fe X line at 6374.56 A):

The other possible lines, but probably more difficult, are Fe XI at 7891.89 A, Fe XV at 7059.59 A, Fe XIII at 3388.10 A.
Under the conditions of this observation, the atmospheric diffusion prevents seeing the green line at 5303 A in the raw images. You have to work on the fly. The spectrum section presented below (extract from the acquisition "crop", after rectification of the lines) gives the position of the Fe XIV coronal line, as well as the position of the associated reference zones (Ref #1 and #2) used for extract distinct images, necessary for processing:

For each scans performed, 3 images are extracted: an image at the position of the Fe XIV line (X = +5 pixels), called C and two reference images Ref #1 (at X = -5 pixels) and Ref #2 (at X = +10 pixels). The calculation of the final image of the corona is fundamentally based on a differential method (the sky background is subtracted from the raw image of the corona), by doing:
Corona image = C - (Ref #2 + Ref #1) / 2
Note that one can also compute a check image, which must be relatively flat, by doing:
Check = Ref #2 - Ref #1
Several scans can be averaged to increase the signal-to-noise ratio.
In the present case, the images were extracted using the Scan2Fits tool from ISIS (an automatic tool is planned in INTI).
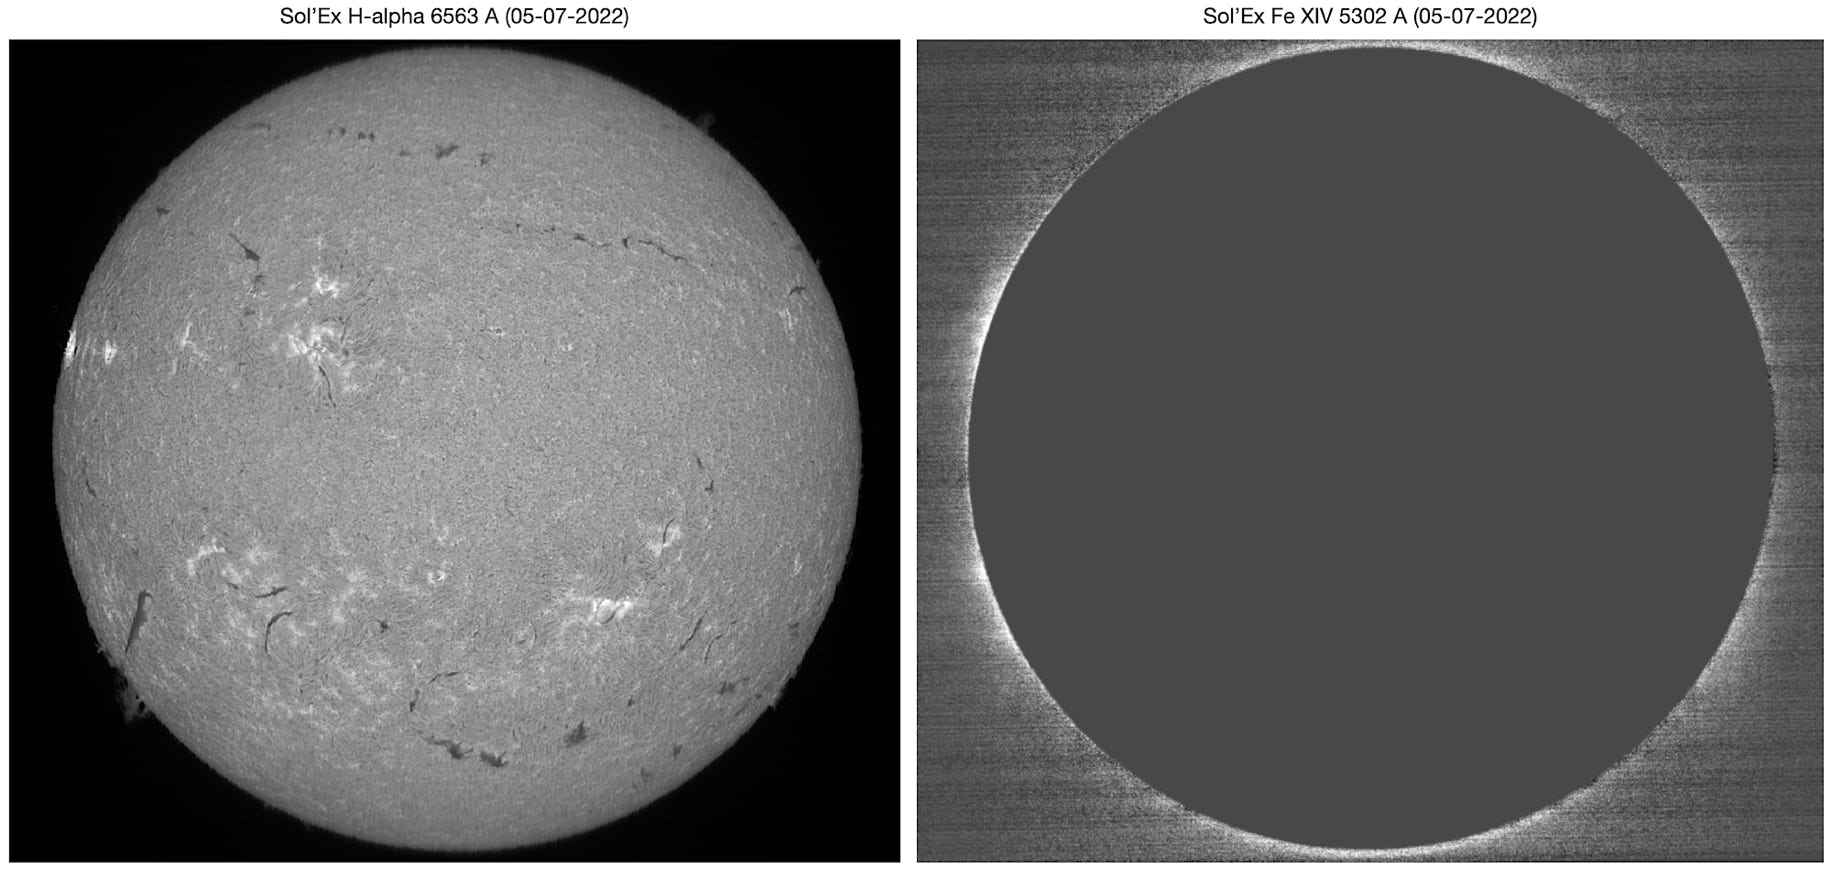
Finally, for the date considered, here is a comparison between the image of the chromosphere in the hydrogen H-alpha line (of course obtained with Sol'Ex) and the image of the Fe XIV low hot corona:
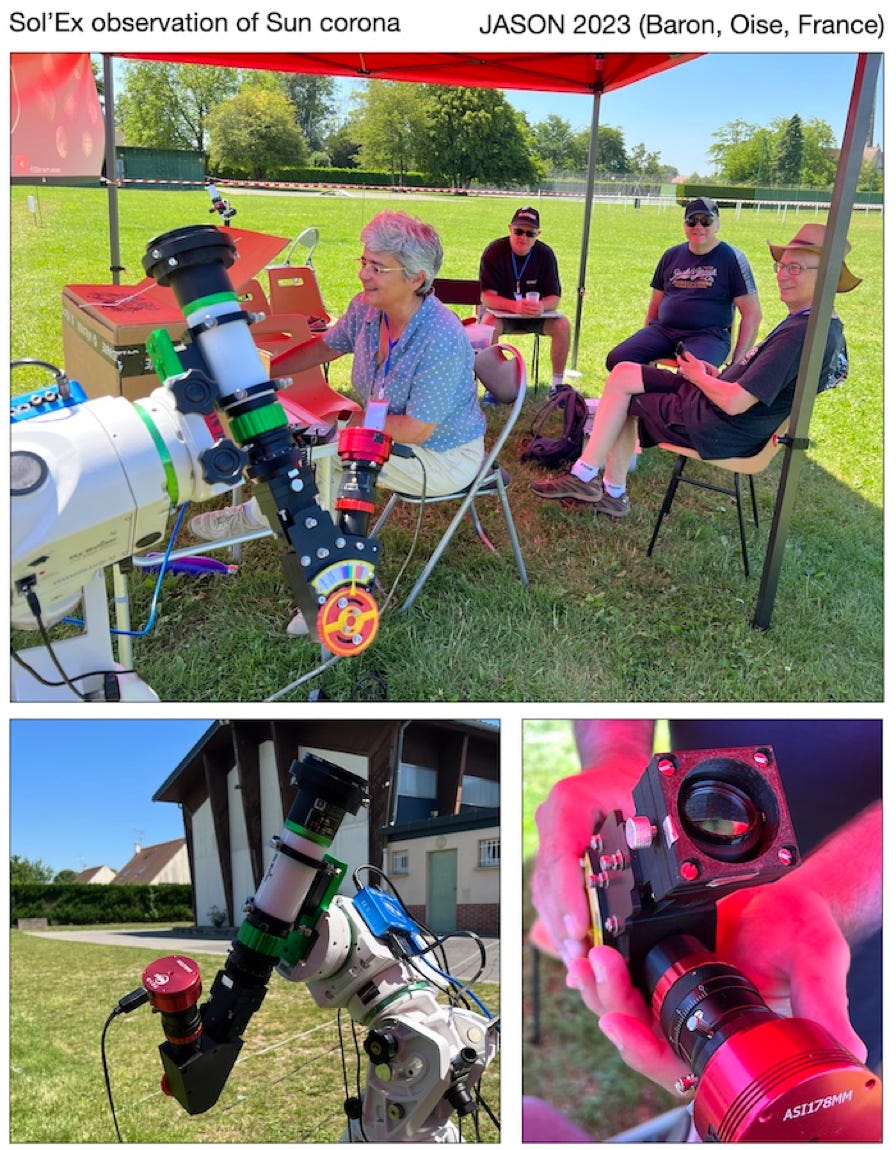
Observing the corona is very easy with a compact instrument, offering a wide field of view. Here's a report on an observation in the Fe XIV line at 5303 A made in this spirit. It took place as part of a gathering of solar observers, JASON 2023 (see opposite).
Here, Sol'Ex is mounted on the back of a small EVOGUIDE 50ED refractor (a quality finderscope/guide with a good APO objective). The lens is closed to f/7 by adding a diaphragm at the entrance (34.6 mm diameter, 3D printed). The idea is to obtain a sharp image, but above all, to reduce, a priori, the stray light in the instrument, in order to maximize image contrast, which is essential for this type of observation.

To further enhance contrast, a Baader Solar Continuum filter, initially set at 540 nm, is used as a pre-filter. This is tilted by around 25° to move the transmission peak to 530 nm just in front of the slit. This is achieved using a handy 3D-printed accessory available from Azur3DPrint - see opposite.

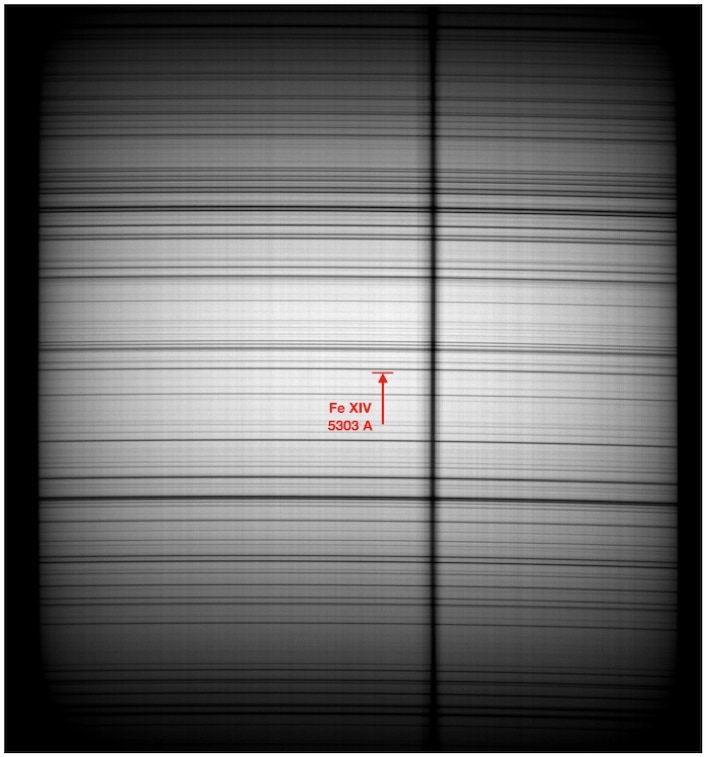
Here's how the spectrum around the Fe XIV green line looks through the tilted Baader filter. The filter's bandwidth limits can be seen at the top and bottom of this image (blue is at the top). The filter's inclination is adjusted to obtain maximum luminous intensity at the coronal line (normally invisible, but whose position is indicated by the arrow). The image of a large sunspot on the slit causes the wide vertical line.
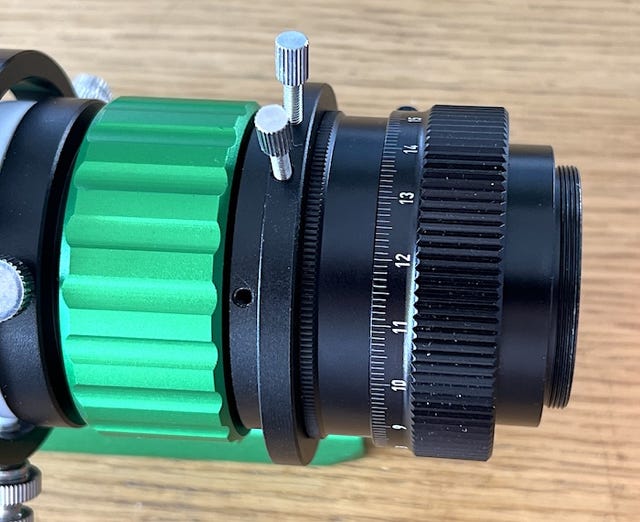
There's another detail to note when using the EVOGUIDE 50ED telescope. While the optics are superb, the helicoidal system (green in color) is not at all up to scratch, making the focusing of the Sun's image on the slit rather painful (presence of a very strong hysteresis play). For this reason, a second high-quality helical system has been added, making operations much easier. This is the TSHELI-FMA model.
To this is added a rotating ring for easy orientation of the Sol'Ex with respect to the celestial east-west axis, in this case model TST2ROT.
Below, the result obtained on June 26, 2023. Sol'Ex images of the photosphere and chromosphere are also added for context.
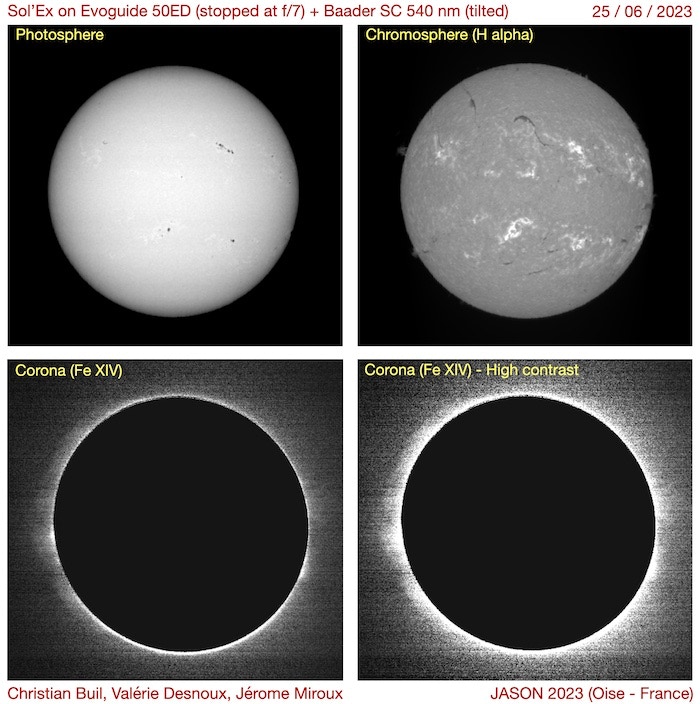
The aureole surrounding the disk in the green line is mostly real (it disappears when outside the Fe XIV line). The corona image is extracted using the INTI software's "Free" tool. Below, a comparison with SDO images taken from space on the same day:

Part 16: How to observe magnetic field
It is perfectly possible to remotely detect the presence of the magnetic field on the Sun surface with Sol’Ex. This is a delicate observation because at the limit of the performance of our instrument, but feasible with a little method and care. In the end, we will obtain very original images of the solar magnetic field, which we call "magnetogram".
The evaluation of the magnetic field value is indirect because it is done through the Zeeman effect. This consists of a splitting of the lines in the presence of a magnetic field, but in the case of the Sun, where the magnetism remains relatively modest, this splitting is small. The amplitude of the separation is proportional to the strength of the magnetic field The use of a polarimeter, which isolates the circular polarization of the Zeeman components facilitates this measurement for the longitudinal field and makes it possible to note the sign of the field (orientation of the lines of force),
Some brief explanations of the principle of observation are given below:

The following document shows a Sol'Ex measurement of the magnetic field on the Sun's surface on June 29, 2021, compared with a measurement of the HMI instrument mounted on the SDO satellite. The more the representation is in an intense black or white, stronger is the magnetic field. Black and white indicate sign of the longitudinal magnetic field, directed towards the observer or away.

From this confrontation we see that Sol'Ex is well and truly capable of detecting the solar magnetic field and of producing magnetograms, results generally obtained with much larger and more expensive instruments. That this is possible with such a compact and inexpensive instrument is a real accomplishment.
To get to the heart of the matter and the concreteness of this observation, I strongly recommend that you consult this video, which gives many details (click on the image - see also my Astro-Spectro chain :

The observation described in this video is based on the use of an iron line located at the wavelength 6173 A, which although of low intensity has the advantage of being very sensitive to the Zeeman effect (Landé factor of 2.5) and to be well insulated, which makes work easier. The image below will help you locate this line in the red-orange part of the solar spectrum:
In addition to Sol’Ex, you will need a filter holder, easy to print (3D) and install, as well as 3D cinema vision glasses, very economical:


On the left, the filter holder that is installed at the entrance to Sol’Ex and a set of two polarizing filter holders. On the right, 3D vision glasses from which polarizing filters, sensitive to circular polarization, are recovered.
Download the STL files for the the Sol’Ex filter holder system: click here.
If you watch the film indicated above devoted to the observation of the solar magnetic field, you will notice that the processing operations are facilitated if you use version 3.2.0 and above of INTI (to be downloaded from the usual site) as well a small add-on utility called "magnet.exe".
The latter very quickly carries out the operations of registration and assembling for the images necessary for the synthesis of the magnetogram. To download the MAGNET application, click here click here, unzip the ZIP file and launch the executable file in the usual way under Windows (you can create a shortcut on the desktop). An english version is also available here.


On the left, the image of the Sun on April 5, 2022 taken in white light with Sol'Ex associated to a Sky-Watcher 72ED refractor and with a HOYA ND16 filter at the input (for polarimetric observations it is impossible to use a configuration using a Herschel helioscope because the latter produces its own polarization which scrambles the sun’s polarisation information). On the right, the Sol’Ex magnetogram for the same date. It can be seen that the active centers are bipolar elements and that the sign of the magnetic field reverses between the northern and southern hemispheres (in these images the north is at the top).
Part 17: The « cinematrographic » observation
We don't forget that the Sun is a dynamic star, with changes that can be very rapid. This is the opportunity to make videos of these phenomena. Below, an animation of the first observations made with Sol’ex (May 5, 2021) - 36 images taken with a time spacing of 5 minutes:
Part 18: A solar spectrum atlas
If a spectrographic neophyte can successfully use Sol’Ex, it must be admitted that the first contact with a star's spectrum can be confusing if one has never been confronted with this kind of situation. To help you find your way around, to understand what a star spectrum is, this "bar code", which is the physical signature of the star, I suggest you download, by clicking on the image opposite , an atlas of the solar spectrum produced by Olivier Garde. In the form of a single image and in visual colors, you will have a global view of the solar spectrum, with the additional identification of the chemical element responsible for a particular line. This tremendous work by Olivier was carried out with an ESP scale type spectrograph (Shelyak Instruments) at very high resolution (R = 30,000, this means that the fineness of the details in wavelength is equal to the wavelength divided by 30,000. ).
A very good exercise is to compare Olivier's spectral map to the real data that comes from Sol’Ex. You can explore the spectral domain by moving the grating gnob, in either direction (note: you may need to retouch the camera focus to ensure sharpness of the observed spectrum area. due to the residual chromatism of the lenses used in Sol'Ex). A small difficulty is that the spectrum returned by the camera is in gray level, while the Olivier spectrum is in color. The exercise amounts to recognizing at the end of the code the patterns of the barcode between the two. You will be surprised to get there very quickly, as if you were reading a road map. The specter of the Sun will become your territory!
See also the guided tour in the form of a video in part 14 of the "Construction" section of this site, or the extracts of Sol'Ex spectra below.
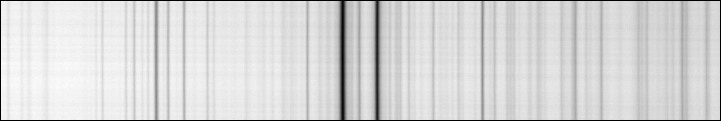
Some region of the solar spectrum. The H&K lines (UV spectral domain):

H-beta line (hydrogen):

Magnesium triplet (green part):

Sodium Na I (D1 & D2 lines):
Red H-alpha line:

In summary, this is how the global view of the solar spectrum looks in its visible part:

Copyright (C) 2020-2023 Christian Buil
Web : www.astrosurf.com/buil