
- Theoretical Elements
- SHG with a 115/900
- SHG with 90/1300 refractor (p.1
 )
) - SHG with 90/1300 refractor (p.2 )
- Newton 192/950
- Dobson 80/400 'Babydob'
- Ultra-simple solar spectrum
- Misc. electronic layouts
- Misc. optical layouts
- Untransversaliumisator software
- Processing videos software
- "PUSH TO" DIY system
- Radio control RA, Dec & focus
- Focuser 3D pour Vixen 150/750
- Year :
- Synoptic maps :
- Videos
- Maunder's Diagram
- Cycle 23 in images
- Venus Transit 2004
| Spectrography - Brief reminders
|
To get the spectrum of a light source, one uses either the phenomenon of refraction by means of a glass prism, or the phenomenon of diffraction by means of a grating. Generally speaking one can speak of dispersor. The prism has the advantage to be very luminous because all the light which crosses it forms a single spectrum while the grating produces several spectra. But the grating remains the optical the most interesting to make a spectrograph because it allows very wide dispersion and especially almost linear. The wasting light by the simple gratings was reduced by giving a particular profile to the engraved lines: one speaks then about gratings which are blazed. They send back a strong proportion of light in a given order and centred on a particular wavelength. Only the grating will be approached afterward
Let us take as light source the image of the Sun supplied by a telescope. Different kinds of spectra can be obtained according to the way by which we proceed:
|

   |
|
Spectroscope with slit layout |
|
A spectroscope essentially consists of:
|
 |
Use of the linear sensor CCD in spectroscopy The electronic recording of the photometric profile of the solar spectrum is very easy to do with this type of sensor. Once positioned in the direction of the spectrum, every photosite receives a certain quantity of light and it translated it into electric voltage. (See the SHG page for more details about the CCD sensors) |
|
 |
Location of the CCD sensor in spectrograph mode. The portion of spectrum to be recorded is brought on the sensor |
 |
Photometric profile of the lines H and K (ionized calcium) (393.4 et 396.8 nm) The dispersion is 1,1 nm / mm in the 1st order |
Why all these lines ? The photosphere produces a continuous spectrum equivalent to an incandescent solid, that is an infinity of radiations which we perceive as a palette of colours going from purple (380 nm) to red (750 nm). Beyond these values, one speaks about ultraviolet (U.V.) and infrared (I.R). Here is visible solar spectrum. The dark lines which streak the colored continuum of the spectrum are provoked by gases situated between the photosphere and the observer. Every chemical element, by absorbing a very accurate quantity of energy, is going to leave its signature in the form of characteristic dark lines. Among these lines, some are due to the sun atmosphere and the others to the Earth atmosphere. Fraunhofer, in 1814, indicated the main lines by letters. We still use some of these notations today; for example, we say "K line" about ionized Calcium line or "D lines" about Sodium doublet. It is interesting to note that the study of the spectrum of a star allows so to realize - among other things - a qualitative analysis of its atmosphere. |
Examples of portions of solar spectrum obtained with the spectrograph |
|
magnesium lines (triplet)
sodium lines (doublet)
Band of oxygen |
|
The distinction between the telluric and sun spectral lines can be revealing by comparing a spectrum when the Sun is high in the sky and an other one when the Sun is close to the horizon. In the second case, the light crosses a thickness of atmosphere bigger than in the first case, and the telluric lines are then more intense. |
The width of a spectral line is not infinitely narrow. It presents a certain distribution of the light intensity (a "profile") and thus width known as "natural". This profile can vary considerably according to the physical conditions in which the gas is subjected. Let us quote for example:
The study of the profile of spectral lines makes it possible to determine some physical conditions reigning in the atmosphere of stars. |
| The profile of a line breaks up into a centre and two wings (a red wing towards the biggest wavelengths, and a purple wing on the other side). One can consider the profile of a line as the result of the opacity of the solar atmosphere for a narrow portion of the continuous radiation emitted by the photosphere. In the center of the line, the opacity is maximal and a zone of high altitude is observed. On the contrary, towards the extremity of wings, the opaqueness of the atmosphere aims towards zero, one joins the continuum of the spectre and so the level of the photosphere, indicated as reference height. This is also valid for the lines observed in emission (case of prominences). The spectral continuum does not exist any more because the photosphere is replaced by the "black" sky. On the other hand, the atoms which absorb the light coming from the photosphere emit this brilliance in the same characteristic wavelengths. |
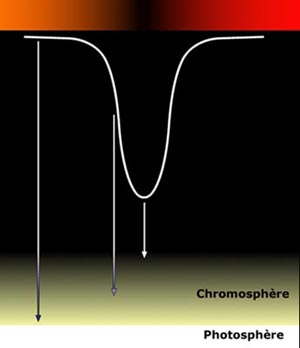 |
It ensues so from these considerations that it will be possible to observe structures situated at various heights in the solar atmosphere, as one will take place in such or such line and at more or less big distance of its centre. This is however to surround some reserves:
|
|

 |
Let us consider an static oscillator with a frequency F. It emits waves which goes away from him, in the style of "circles in the water", the fronts of waves are concentric and equidistant. Now, let us consider the same oscillator in movement, arrived at the point Ct of its trajectory. It always emits a wave which goes away from him, with the same frequency. The front of wave A was emitted when the oscillator was at the position At. Idem for the front B emitted in Bt. The right observer sees the waves arriving with a frequency higher than F while the left observer sees them arriving at lower frequency. The observed wavelength is shorter (blue-shift) for the observer who sees approaching the source but it is bigger (red-shift) for the one that sees it going away. |
|
|
Doppler-Fizeau effect in a solar prominence The axis of the line of the Hydrogen said " H-alpha " is marked by the yellow line. In certain places (A), the prominence appears in the center of the line, so with a no speed with regard to the observer. In other places (B), one can see a halving of the image: a part of the prominence approaches and the other one goes away from the observer.
|
|
|
