- Theoretical Elements
- SHG with a 115/900
- SHG with 90/1300 refractor (p.1
 )
) - SHG with 90/1300 refractor (p.2 )
- Newton 192/950
- Dobson 80/400 'Babydob'
- Ultra-simple solar spectrum
- Misc. electronic layouts
- Misc. optical layouts
- Untransversaliumisator software
- Processing videos software
- "PUSH TO" DIY system
- Radio control RA, Dec & focus
- Focuser 3D pour Vixen 150/750
- Year :
- Synoptic maps :
- Videos
- Maunder's Diagram
- Cycle 23 in images
- Venus Transit 2004
| Sunspots spectra
|
|||
| Spectroscopic observations of sunspots reveal differences with photosphere spectrum. Causes are multiple. I wanted to make a spectrum of a sunspot and to compare it with the spectrum of the neighbouring photosphere. The temperature of a sunspot, lower than photosphere, must modify the relative intensity of the spectral lines and perhaps reveal molecular bands. I thus took 2 spectra, one with the slit of the spectro selecting the umbra of a sun-spot and the other with the slit selecting an area on the disc without spot. Width of the selected line is about 10 arc-sec. Here are 2 tests, one near the Sodium doublet and the second close to the Magnesium b2, b3 lines.
Some examples of line strengthening in sunspots spectra are labelled with a red point below spectra. Other lines can be more intense in photospheric spectra and are labelled with a red point above spectra. Temperature, magnetic fields, motions of matter are factors which induce alterations on solar spectrum. Many lines are without relationship with the Sun and originate in our atmosphere. This other image, taken with a webcam, shows the reinforcement of the Ti I line (5426.26) in umbra of a sunspot
|
|||
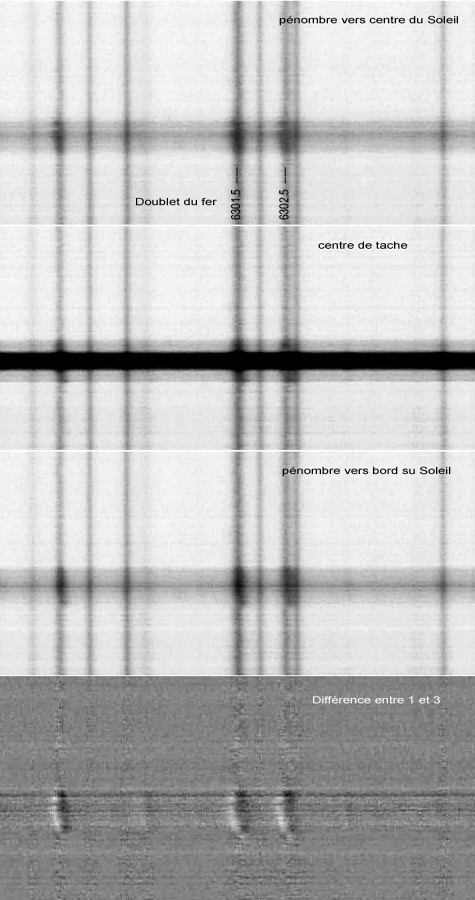
Observing Evershed effect The spectroscopic observations of the sunspots and photosphere reveal substantial differences. The causes are multiple. In this case, one can observe below an asymmetrical widening of some spectral lines when the spots are close to the solar limb. More precisely, it is noted that widening is towards the short wavelengths when the slit of the spectro is placed on the penumbra turned towards the center of the solar disc, and towards the long wavelengths when the slit of the spectro is placed on the penumbra turned towards the the limb. |
|||
|
|||
The fact that the spectral shift appears only when the spots are close to the solar limb indicates that the angle of observation of the spots is an essential parameter. The interpretation of this phenomenon, once again, is the Doppler-Fizeau effect :
Plasma seems to emanate from the central part of the sunspot, the umbra, and to flow in the penumbra, towards the outside of the spot. When the spot is seen in the center of the disc, plasma has only tangential motion and the spectrum does not reveal any asymmetrical shift. Conversely, at the limb of the solar disc, because of different angle of observation, the motion of plasma has a radial component, i.e. on the line of sight of the observer. |
|||
|
|||
The difference between images, as for spectra, highlights much better the Doppler shifts. The images below are obtained by subtraction of spectroheliograms λo-Δλ and λo+Δλ. All the images are obtained simultaneously. The structures with radial motions then look like a low-relief sculpture and the sunspots suddenly acquire a resemblance to lunar craters. from left to right, Δλ = 31mA, 135 mA and 238 mA, which corresponds about to radial speeds 1.5, 6.4 and 11.3 km/s Ā |
|||
|
|||
It is interesting to compare the aspect of the sunspots and surrounding areas according to radial speeds : The plasma of the low chromosphere seems moving at rather low speeds, from 1 to 10 km/s, because there are not almost more details (aspect in "orange skin') visible on the 3° image. Conversely, the spots are almost invisible on the image of left. Plasma moving in the penumbra has speeds in a little higher range of values. The limit between the speed of plasma in the spots and that of surrounding plasma is very clear. It seems shown that the matter arriving at the edge of the penumbra is diving under photosphere (cf. KIS). The axis red-shift -> blue-shift is not exactly towards the center of the solar disc. It is particularly obvious for the upper sunspot. Also read : Observations de Christian Buil |
|||
|