| Cataclysmic Variables |
Cataclysmic Variables
![]()
| Cataclysmic variables are binary stars system which includes usually a white dwarf very close to (typically) a low-mass main-sequence star, like a red giant. By orbiting so close to each others, gaz from the big giant flows following magnetic field and/or gravity field and falls on the white dwarf. This material flow creates an accretion disk around the small star and from times to times, nuclear reaction starts and the system shows a brightness increase also called an outburst, from 2 to 8 magnitude, with period which can be as low as few days up to several decades.
Several sub-classes are include as Cataclysmic Variables. You can refer to the very good description of each of them on the AAVSO site, at http://www.aavso.org/vstar/types.shtml
For a deeper astrophysical description, you can also refer to http://www-phys.llnl.gov/Research/CataclysmicVariables/ For a living edition of a star catalog: "Catalog and Atlas of Cataclysmic Variables (2001, PASP 113, 764)" by Ronald Downes, et. al , refer to the site at http://icarus.stsci.edu/~downes/cvcat/ The cataclysmic program has started at the T60, Pic du Midi observatory. They are usually quite low brightness objects, which are difficult to image with a standard amateur telescope. That's why, with the 60cm telescope and different types of "Buil's made" spectrographs we wanted to check if a regular observation program can be envisioned under the T60 association using the 60-cm class telescope. In the new ARAS group, (Astronomical Ring for Amateur Spectroscopy), call for other amateur programs can be undertaken. Professional which are looking at this page are more than welcome to take contact and propose observations targets, methodology improvements as well as data request. All the light curve presented are not data validated but comes directly from the AAVSO database, with their permission. This site is a must to get latest observational data and news on the most recent stars outburst. All the following observations have been reduced using IRIS and Visual Spec. The method used is the standard one described in a specific page on spectral data pre-processing. Most of the spectra reference are extracted from an article of Williams, G. 1983, ApJS, 53, 523 "Spectroscopy of Cataclysmic Variables. I. Observations" |
|
| SS Cyg |
2nd July 2002 |
| EX Hya | 24th April 2003 |
| RX And | 19th July 2003 |
| AH Her | 24th April 2003 |
| HR Del | 19th July 2003 |
| V Sge | 19th July 2003 |
| Observations | |
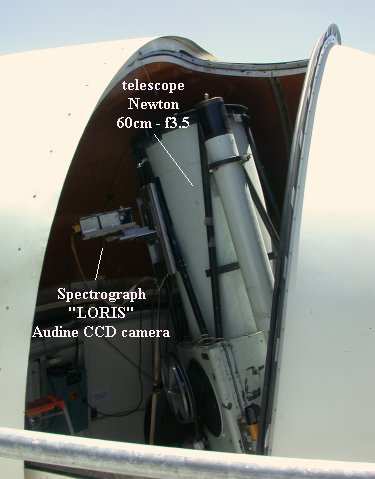 |
Observations was made at the Pic du Midi observatory, using the 60cm f3.5 newton telescope at the disposal of amateurs in the frame of the T60 association.
Two types of spectrograph have been used. The first version was a medium resolution spectrograph, described here. The sampling factor is around 5.7 Angstrom per pixel. The second one is a special design to image spectra of low - brightness object. The "LORIS" is described here. The low resolution of spectra was a trade-off to target low magnitude objects. Depending of binning used, the sampling factor was around 8 or 16 angstroms per pixel. All spectrographs have been designed by Christian Buil |
SS Cyg is the prototype of cataclysmic variable from the dwarf novae class. Its minimum of brightness is one of the brightest of the cataclysmic stars.
| SS Cyg U Gem Class |
RA: 21 42 42.66 Dec: +43 35 09.5 |
mv=8.2 v - 12.1 v Spc Type: |
|
||||||
| SS cyg was already declining and on its way to the minimum or also called quiescent state. Balmer lines and He I lines are in strong emission above the continuum. | ||||||
 |
||||||
| The spectrum below is shown with continuum normalized at 1 beetween 5200 and 5220 angströms. It is the same spectrum as above.
|
||||||
|
Date : 24 April 2003 - 2:45 TU - sum of 10 images of 60 s
|
||||||
|
At this time, the star is close to its maximum of magnitude. The spectrum is not showing strong emission lines but all balmer lines are now in absorbtion. Only a He II emission line is barely visible. Also the continuum is not as steady as in the previous observation. H-alpha is also barely distinguished. |
||||||
 |
||||||
| The spectrum below is shown with continuum normalized at 1 beetween 5200 and 5220 angströms. It is the same spectrum as above.
To compare, here is an example of spectra taken by professionals at the two different states of the light curve.The same spectrum evolution is observed. |
||||||
 |
||||||
| "Spectral atlas of dwarf novae in outburst" by L. Morales-Rueda and T. R. Marsh (Mon. Not. R. Astron. Soc. 332, 814-826 (2002)) | ||||||
EX Hya is an eclipse binary - the first one which has been associated to an XR source.
| EX Hya |
RA:12 52 24.4 Dec: -29 14 56.7 |
mv=10.0 v - 14.1 v |
|
Date : 24 April 2003 - 22:47 TU
From the AAVSO light curve, there is no evidence of approaching a min or a max of activity. By looking at the light curve on the all year, it seems to be closest to a max than to a min. |
 |
| The EX Hya spectrum shows the Balmer lines in emission as well as the He I line. They all seemed to have double peak. |
 |
| If we consider the spectrum from the Williams's article, we observe the same type of spectrum. The calibration has not been made using a spectrophotometric standard so the intensity measurement and Equivalent Width measurements are not valid. Also, as no external calibration lamp has been used to calibrate the wavelength no radial velocity can be measured as well.
The spectrum below is shown with continuum normalized at 1 beetween 5200 and 5220 angströms. It is the same spectrum as above. The Balmer lines intensity is about 2.3 above the continuum which has been normalized to 1 on the 5200 - 5220 region.
|
 |
![]()
| RX And |
RA:01 04 35.55 Dec: +41 17 58.0 |
mv=10.9 v - 12.6 v |
RX And is another example of a dwarf Novae.
| Date : 19 July 2003 - 2 : 21 TU - sum of 16 exposures of 120s
|
| The spectrum has been taken very close to the minimum state. Balmer lines as well as He I lines are in strong emission. |
 |
| The spectrum below is shown with continuum normalized at 1 beetween 5200 and 5220 angströms. It is the same spectrum as above.
To compare, here below are two spectra from Williams at the two different phases. |
 |
AH Her is a dwarf Novae.
| AH Her |
RA:16 44 09.99 Dec: +25 15 02.1 |
mv=11.3 v - 14.7 v |
| Date : 24 April 2003 - 1 : 38 TU - sum of 10 images of 120s
|
| The spectrum is taking during a relative steady phase, close to the maximum. The spectrum is very noisy with no evident features. |
 |
| The spectrum below is shown with continuum normalized at 1 beetween 5200 and 5220 angströms. It is the same spectrum as above.
A spectrum from the Williams article is shown below, but probably not taken at the same phase of the light curve. |
 |
HR del is a rest of a Nova. Its latest outburst was in 1947 and reached the 3.4 mag. Its luminosity is more or less around m=12. HR Del is a binary star.
The HR Del spectrum is dominated by strong emission lines including a proeminent set of lines [OIII] ll 4959 + 5007 Ang which characterizes a nebulous which is surrounding the star now and may still evolve with time.
| HR del |
RA:20 42 20.3465 Dec: +19 09 39.314 |
mv=3.5 v - 12.3 B |
| Date 19 July 2003 - 1 :05 TU - 10 exposures of 120s.
|
| Among the Balmer emission lines, the [O III] line from the surrounding nebulous is quite visible. |
 |
| The spectrum below is shown with continuum normalized at 1 beetween 5200 and 5220 angströms. It is the same spectrum as above. |
 |
V Sge is a Nova-like star
| V Sge |
RA:20 20 14.75 Dec: +21 06 09.0 |
mv=10.5 V - 14.5 V |
| Date 19 July 2003 - 0 :09 TU - 10 exposures of 120s. Binning 1x1
The CIV line and He II emission lines are visible among the Balmer lines. The He II line at 4686 angström is quite proeminent, surpassing the Balmer lines. The spectrum has been calibrated in relative flux with a standard star 26 Peg, A2V m=3.53 |
 |
| The spectrum below is shown with continuum normalized at 1 beetween 5200 and 5220 angströms. It is the same spectrum as above.
A spectrum from the Williams article is shown below. |
 |
![]()
![]()