| From pixel to wavelength |
Once the intensity curve is obtained, through binning, the next operation consists of establishing a relationship between pixel and wavelength.
The composition of the light has been spread out by the spectroscope device according to wavelength. Depending of the mounting chosen, this relationship can be close to linear: an equal number of pixels correspond to an equal domain of wavelength.
Theory of operations![]()

An equation links the pixel number to a specific wavelenght :
|
Wavelenght = a*Pixel_number + b
|
|||||
| Once this relationship is established for the optical combination of the spectroscope, this is more or less valid for all the spectra recorded with this very same combination.
The "a" coffecient is the sampling of your system. The higher it is, the highest resolution you have, this mean the more easy it will be to separate lines when they close to each other. |
However, it is strongly recommended to recompute the relation for each spectrum in order to eliminate small variations like mounting/dismounting, small mechanical displacements, telescope equilibrium, atmospheric transparency.
|
||||
How to identify which intensity correspond to which wavelenght ?![]()
Several options shall be considered:
| The spectrum itself shows easely identifiable lines which allow self-calibration | ||||
| A spectrum of a well-known star which exhibits recognizable lines is recorded before or after the studied spectrum | ||||
| The spectroscope assembly includes a calibration lamp |
![]()
The usage of a calibration lamp is the most accurate way to calibrate spectra. On the opposite, using the spectrum itself does not work properly in all cases and show low precision as it cannot account for doppler measurements. But this is probably the easiest one to start with.
![]() Wavelength calibration with the spectrum itself...
Wavelength calibration with the spectrum itself...
As the spectrum is calibrated by respect to itself, it will not be possible to measure doppler effect as it needs to take into account wavelength shift versus the absolute value which you do not have.
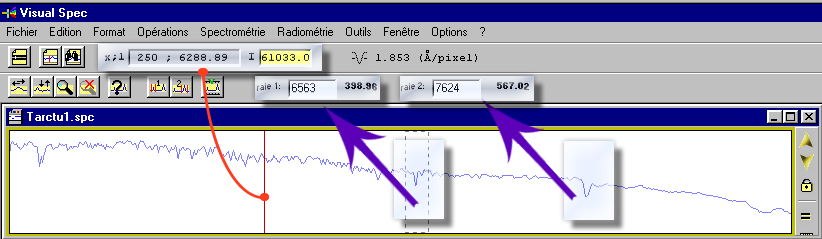
This method works properly if at least two lines are easely identifiable. To calibrate the profil, you need to assign the right wavelength to each of the two lines and Visual Spec will do the rest by computing the linear fit for each pixels. As a result, each pixel will correspond to a wavelength and by dragging the cursor over the profil you will see dispayed the corresponding wavelenght.
![]() Wavelength calibration with a reference star...
Wavelength calibration with a reference star...
If the assembly does not allow to image domain beyond 6600 angstrom, it will not be possible to use atmospheric lines as they will no show up on the spectrum.
To calibrate the spectrum of the reference star, you need to identify two lines and to assign through Visual Spec their corresponding wavelength. Once this is done, you have to load the spectrum you want to calibrate. It is mandatory that this spectrum has been recorded in the very same conditions to not introduce errors. The assumption is that the sampling coefficient will be the same for both spectra.
![]() First step is to record the spectrum of a known star for reference, with lines easely identifiable. Then, this spectrum shall be calibrated. Once done, the sampling coefficient shall be recorded on a piece of paper.
First step is to record the spectrum of a known star for reference, with lines easely identifiable. Then, this spectrum shall be calibrated. Once done, the sampling coefficient shall be recorded on a piece of paper.

![]() Now,the spectrum to calibrate is loaded, and it is sufficient to identify only one line. By entering the same sampling coefficient, the new spectrum will be calibrated as well, and by dragging the cursor over the spectrum, wavelength will be displayed
Now,the spectrum to calibrate is loaded, and it is sufficient to identify only one line. By entering the same sampling coefficient, the new spectrum will be calibrated as well, and by dragging the cursor over the spectrum, wavelength will be displayed

![]() Wavelength calibration with a calibration lamp...
Wavelength calibration with a calibration lamp...
In this very special case, there is few lines present. The first aproximation is done by knowing by construction which spectral domain is targeted. Usually, spectroscope includes such control, the rotation angle of the camera versus the grating is a first indication of the spectral domain. The second approximation is that by shooting in the H-alpha region, the strong line in emission shown on the star which is a Be star is likely to be the H-alpha line. By looking at which lines are around 656.3 nm on the argon spectrum, the two lines are likely to be the 606.4 nm and the 653.8 nm argon lines. After wavelength calibration on the Argon spectrum, one checks that star emission line is well set at 656.3nm...
The method is the same as for the reference star. But instead of using a star spectrum, this method use the artificial light from a lamp which exhibits emission lines. By knowing the composition of the lamp, you can easely identify key lines and find in tables their wavelenght.
In my past experience I used Argon lamp, but Neon lamp shall work as well. You just need to take care that the type of lamp you are using exhibits lines in the wavelength domain you are observing. In Infrared, Argon lamp does not have a lot of lines, which can be an issue at high resolution.
![]()
This is the technic used by professionals. It will works for all types of spectra, in all type of optical combination.

![]() Once the two spectra has been recorded, they shall be both reduced by binning into the same profile. As they were acquired in the same conditions, the Argon spectrum can be superimposed on the object spectrum, and Argon calibration will apply too.
Once the two spectra has been recorded, they shall be both reduced by binning into the same profile. As they were acquired in the same conditions, the Argon spectrum can be superimposed on the object spectrum, and Argon calibration will apply too.
It is easiest to calibrate the Argon one, as emission lines can be found in laboratory tables. In Visual Spec, a library of such lines are includes.
![]() The argon spectrum as per laboratory tables
The argon spectrum as per laboratory tables

![]()
![]()