| Spectral analysis |
| Spectrum is like a signature of the star. It gives access to number of star parameters.
Do you want to generate your own star and compare it with some of your acquired spectrum ? To understand the physic behind it, visit the site of Dale Mais. It is a must before you go further... It gives full explanation of the physics law which drives the production of a spectrum depending of the element abundance and temperature. You need to understand this before jumping into another nice free software which generates theoretical spectral given some physical parameters. Another fun game is to play Sherlock Holmes and to try to identify the lines in a given spectrum by using different lines database embedded in Visual Spec. In this section, I will first give you an example of usage of the "SPECTRUM" software, and I will then show how I used the Spectrum Line database to identify lines in Arcturus spectrum as first pioneered by a German team |
||
Line identification is not an easy task. We are not professional, so it is not obvious to understand some physics law which help profesionnals to identify lines knowing the star physic. Amateurs will not discover new lines... this is an example of the limitation of this process for amateurs. Nevertheless, curiosity is always rewarded ! you may have specific studies where this tool can help you, like study of metallicity or other peculiar stars. |
||
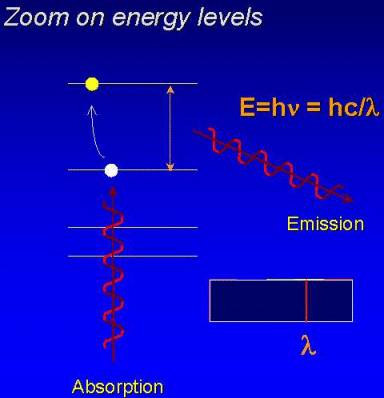
Why do we have certain lines in a spectrum ? If a specific line show up in a spectrum this first means that a transition has occured i.e. an energy exchange has taken place by outputing a photon which carries the difference of energy when an electron moves from one atom energy level to another one. The frequency of the photon, which is equal to the wavelength you will mesure is linked to the energy difference by the law E=hc/lambda - lambda beeing the wavelength.
When an electron captures a photon this allows it to jump to a new energy level. After a certain period of time, the electron will move back to its original level and will eject a photon which carries the energy difference. So the bilan is null... why do we see lines ? Photons which are captured comes from a certain direction, let's consider the direction in our linesight. After beeing absorbed by an electon, they are emitted again, but they will be sent out in any direction and not only in the one they were coming. So, if you consider the number of photons absorbed versus the number of photons emitted in the direction of viewing, you will see less emissions than absorption at this wavelength, you will see an aborbtion line !
The next question will be then why do we see absorbtion of this element and not of this other one ? Why Ca lines and Fe lines and not Rh or Mo lines ? The first basic answer is that not all atomic elements are present in the star. You may have Iron, but not Rhodium or Molybdenium... But not only. It also greatly depends of the abundance of the element and their ionization state which is highly dependent of the temperature and the pression. The intensity of a line i.e. its depth is directly function of the probability of such transition and of the total number of atom in this excitation state. There are two fundamentals physics law which describes this, the Saha and the Boltzmann equations.
Equations and excercices can be fund in A.Acker & C.Jaschek "ASTRONOMIE Méthodes et calculs" excercices corrigés - Ed. MASSON. As mentioned by Dale Mais, in old times, curve of abundance were used to determine the element density in a star or in nebulous by considering the temperature and the relative intensity of lines for a same element. (lines at different transition). If we know all the equations and the parameters, then can we create stars spectrum ? Having all this in mind, we do understand that we can in fact compute the theoretical spectrum of a star knowing temperature, pressure, atoms interns parameters and atom list. If we add some other parameters which influence the line formation like the metallicity (expected ratio of metallic lines versus the sun spectrum), the microturbulence (speed of atoms/ions can increase the probability of absorption), you understand what a synthetic spectrum software needs to generate a synthetic spectrum. The modelling is at the core of the professional work. Mulitple teams are working over the world on the best "star simulator", the set of equations and effects are scrutinized to endlessly improve the prediction. Surf the web and see where this science is at today ! Two of this models are provided with SPECTRUM software package. If you want to get more, you have to contact the Kurucz team and/or surf the web. The models I got looked like this: 45045k4p00.mod. - 450 is for the temperature, 4500°K |
||
Synthetic spectra generation with "SPECTRUM" software |
||
|
The SPECTRUM software was written for Unix Platform but on the web site there is a link to a package which emulates Unix on a PC, cgywin. You first have to install the emulator. The installation went well, and I run SPECTRUM on my home PC under W2000. All the required informations are in R.O.Gray pages.
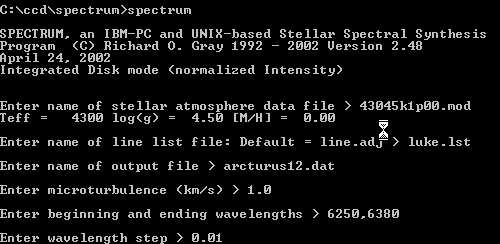
1- enter the name of the model atmosphere, make sure the model is in the Spectrum directory or indicate the full path 2- enter the name of the line list "luke.lst". This line list is provided within the Spectrum package 3- enter the name of the output file. Provide the .dat extension so it can be read directly into Vspec. The file will be created in the same directory than Spectrum unless you specify a full path. 4- enter the micro-turbulence: this is the number which is specified by the atmosphere model. In this case, this is the value just after the "k". Do not forget to enter real number 5- enter the wavelength domain, respect the format, just put a coma with no space, no "-" 6- enter the wavelength step: the smaller it is the bigger your dat file will be... Vspec has limitations, do not generate file with more than 10000 points. You can generate mulitple files by wavelength range. If you pick a lower wavelength pitch, you will have less points, but you will have uncertainty when pointing a line as it can be blended with other ones. 7- That's it ! you will see some computation results appearing on the screen then the full file will scroll in front of your eyes... To get technical details behind the format and functions of SPECTRUM files, go back to technical details section of SPECTRUM web site. Everything is described with clarity. You can even play with the file, by adding element or changing relative abundance, but be careful ! Next step is to move to Visual Spec and open the generated dat file !
Enter name of stellar atmosphere data file > vega.dat
Download the vega synthetic spectrum I have tried to use Vspec line database to identify lines, but at this resolution so many lines were possible that the process failed. For a very detailed line identification, visit Christian's Vega pages. But as we have access for the theoretical spectrum, why not trying to generate one with a much higher resolution to remove the blending effect ?
Download the models: 38045k1p00.mod , 45035k0m05.mod , 53035k0p00.mod , 62530k0p00.mod To identify the lines, I generated a high resolution spectrum and I used the Vspec line database to identify the most visible ones.
When synthetizing a spectrum equivalent to Arcturus, how do you know which models to use ? The way I did was to find on the web the Arcturus parameters. Other way would be to iterate by generating spectra until the profile matchs the observed spectrum. For Arcturus, I found in the UV ESA database: log(g)=2.0, T=4290°K and [M/H]=-0.5 - The best approaching models in my own list was 43045k1p00.mod (download)
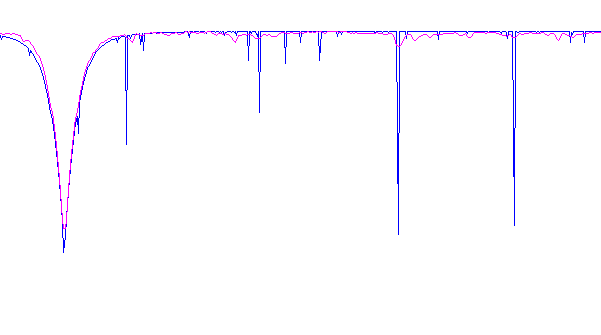
To make sure I did not use a bad model, I did degraded the resolution of the synthetic spectrum with a gaussian filter in Visual Spec. I used a very strong sigma value (>100) - in red on the graphic.
|
||
|
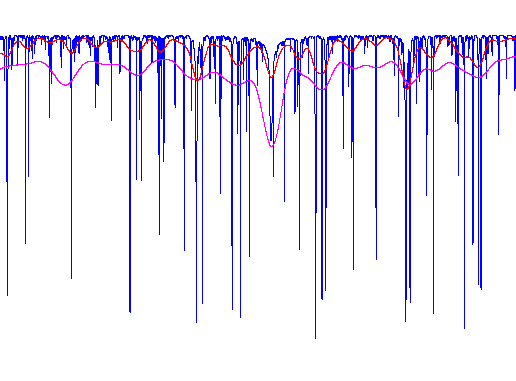
To identify the lines, it is much accurate to refer to line wavelength by looking at the hi-resolution spectrum. The game would be to identify which lines was the most proeminent in a multiple set. I did this excercise on the 6100-6600 angstrom range. I had to generated several synthetic profile to cover the range at this 0.01 angstrom step to keep file size reasonable. The line database to use was a big question To make sure I was referring to the same line list than SPECTRUM, I manipulated the luke.lst file to first cut the file in several pieces to minimize the acess time and second to format it at the Visual Spec database format. I added then a way to acess this complete database from the element window in Visual Spec. |
||
You can get acess to it now from the version 3.0.4. You need to download also the HiRes database which is a conversion of the luke.lst file, zipped and cut in 38 txt files covering 100 angstrom each from 3000 to 6799 angstroms. As in luke.lst, some molecules are in, I converted the numbering convention of SPECTRUM into text symbol to match Vspec format. Also, I did generate "false" intensity by computing exp(log(gf)) the oscillator strength. |
||
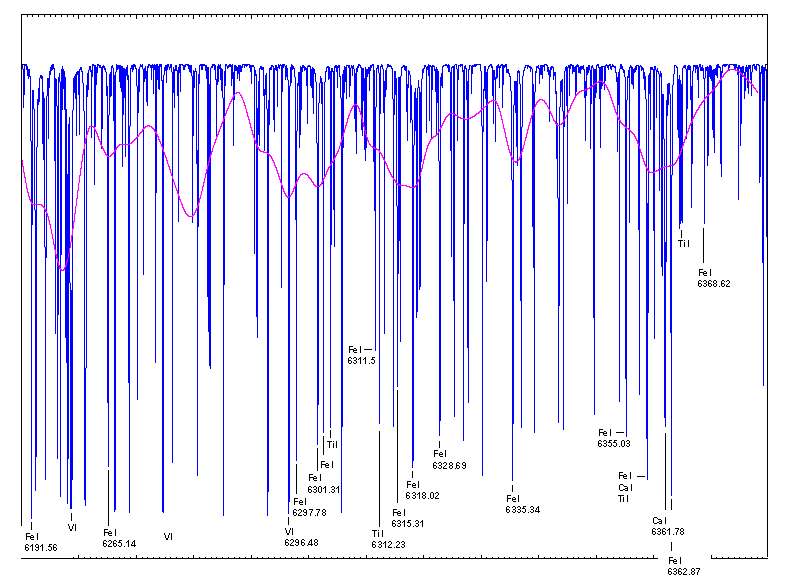
Arcturus - from 6100 to 6250 angstroms
Arcturus - from 6250 to 6380 angstroms
Arcturus - from 6380 to 6500 angstroms
Arcturus - from 6580 to 6620 angstroms
|
||
Lines identification database used in Visual Spec The lines databases are located as txt files in the root of Vspec.exe - They are ASCII files and you can add lines if you want. The details of the formatting is in the user's manual. The newly added "Hires" database if the transcription of the luke.lst file from Richard Gray's SPECTRUM software. It includes 38 text files and requires the 3.0.4 Vspec version at a minimum to be read as well as the separated zipped database file to be downloaded.
VI/16 Line Spectra of the Elements (Reader+ 1980-1981)
VI/71A Revised version of the ILLSS Catalogue (Coluzzi 1993-1999)
J/A+AS/131/431 Accurate wavelengths in the Sun spectrum (Allende Prieto+ 1998) |