| The first operation used after calibration is to compare spectra. This comparaison can be done betwween spectrum of 2 different object or between spectra of the same object acquired at different time. |
| Spectrum comparaison can be done as soon as the two files which contain the spectrum are loaded. |
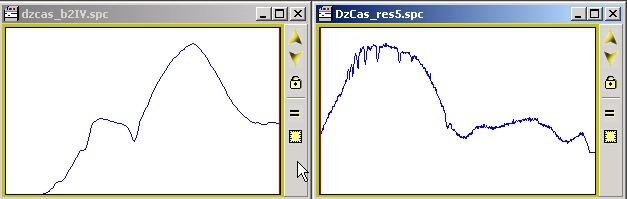
| To set the same wavelength start and end on the 2 spectra so that thay can be displayed with the same scale, click on the first spectrum you want to have all the spectra aligned with. Then click on the "paste format" button. |
 |
| The spectrum on the left has changed wavelength scaling and is displayed on the same wavelenght domain than the right spectrum. |
 |
| If you want to cancel the operation, select the left spectrum, then click on the "unzoom" command |
 |
| Another way to reset the original wavelength domain is though the Graphic Dialog box. You can double click anywhere in the profil or go through the menu. |
 |
| The graphic dialog box will appear. Make sure the Axis X tab is selected then click on the reset button, then ok |
 |
| Another very practical way to compare spectra is to supperimpose them. When the 2 different spectra are loaded, select the serie you want to copy. To select a serie, go in the serie dropdown box and click the serie name you want to select. Or move the cursor on the serie in the profil document, when the hand changed into an arrow, click on the serie profil, the serie name will be displayed and the serie will be selected. When series are perfectly superimposed, it is better to use the dropdown box. |
 |
| Then click on the copy button in the toolbar |
 |
| Select the profil you want to copy the serie by clicking on the top bar of the window document and click on the paste button |
 |
| The copied serie will be added to the dropdown serie list under the name serie8 (or 9, 10...) and will be displayed in the document using the purple color. The copied spectrum have been resampled at the document sampling factor. The cursor will move only on the serie wavelength domain and the serie intensity will be displayed in the upper toolbar. To get acess to another serie intensity and wavelength domain select the required serie. |
| The cursor move will be limited to the zone where the spectrum is displayed. To select another serie you can either go the serie drop-down list, or move the cursor on the spectrum and when the cursor is changed into an arrow then click. The name of the serie selected will be updated in the serie drop-down list. |
 |
| When you just superimpose raw spectra, their intensity are hard to compare, as they may have been acquired in different conditions. |
 |
| If you do acquire the same spectrum but at a different time, you may see differences in the intensity just because the conditions were different, like the exposure time. So if you just supermimpose the two spectra, their intensity will not match and you cannot say if the spectrum has changed. |
 |
It is then important to normalize the two spectra. The normalization process compute the relative intensity for the spectrum regarding a wavelength zone where no lines are present to not compromise the operation.
To select the reference zone to which each intensity will be divided, you have to declare it in the preferences dialog box. Go in the top menu bar and go in "preferences" menu. Select the tab "continuum". Enter the wavelengths which will delimited the zone where the mean will be computed. CLick OK. |
 |
Go back to the profil documents. Select the first profil document, and click on the "Normalize" button  |
 |
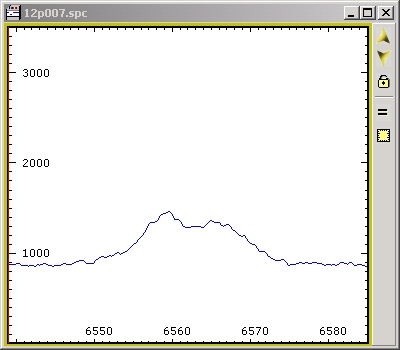
| A new serie will be computed, each pixel intensity will now contained the original intensity divided by the mean of the continuum wavelength zone. Select the second profil document and click again on the "Normalize" button. |
 |
| Now, you can copy and paste one of the serie to the other one and compare the changes... |
 |
| The second point you need to pay attention when comparing two spectra is the sampling coefficient. If one of them have been acquired at a lower sampling factor, the resolution will not be the same and features will not look like the same. |
 |
| You can artificially change the sampling factor of one of the spectrum, by resampling it. Use this function with attention as it may create articicial informations. Select the serie you want to resample. Click on the "recalibrate" button |
 |
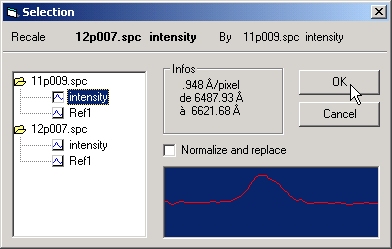 |
| The displayed dialog box asks you to select the new sampling of one of the opened series. (The serie shall be open in one of your profil document opened). Click on OK. The serie will be resampled with the new sampling factor. |
 |
| The last fun function you can explore is the cinema function. This will displayed in one of the profil document each opened serie alternatively. First open all the spectra, and arrange the profil documents. You can use the "Small Windows" menu to do that. |
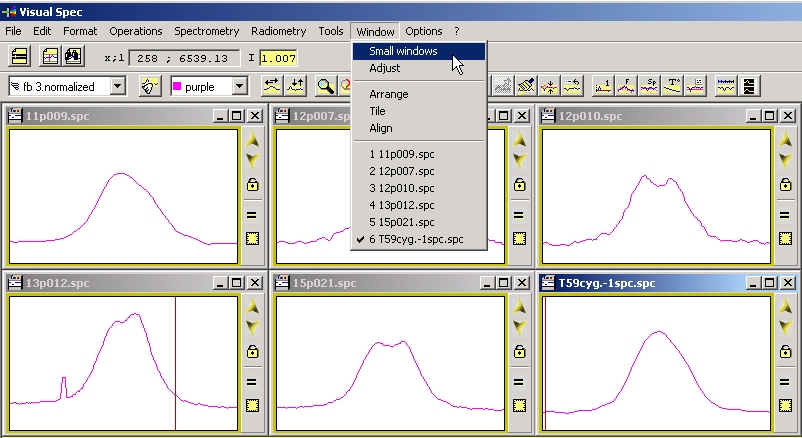 |
| Make sure each serie is displayed with the same scale in X and Y and are normalized to compare relevant data.
Then click on the "Animation" button.  . The animation will take place in the currently selected document. . The animation will take place in the currently selected document.
|
 |
| That's all for today...
You have learned how to superimposed spectra and to make sure the comparison is scientifically relevant by normalizing the intensity.
|