 Visual Spec is not a graphical processings software but have some basic formating features. Visual Spec is not a graphical processings software but have some basic formating features. |
|
Below is the spectrum profile of the Sun in the H-alpha region acquired by S&D Morata.
|
 |
| To modify the scale of the Axis of the graphical display, go into the Graphic Dialog Box - To change the Hi and Lo value of the min and max of the vertical axis, edit the values in the text fields. |
  |
| To see the changes on the graphic, always click on Apply before closing. |
 |
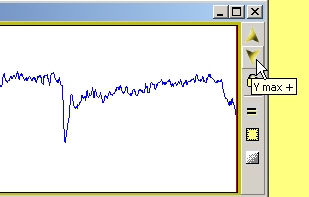
| There is a quickest way to change the maximum value of the vertical axis. Use the two up and down arrow on the toolbar at the right of the document. This changes only the maximum value of the Y-axis. The minimum value can only be changed throught the Graphic dialog box. By default, the min value of the Y-axis is zero. |
 |
| To change the wavelength zone, you can just select the domain you want and click on the zoom button |
 |
| The selected zone is expanded into the document window. |
 |
| To display labels on axis, select the display X axis option |
 |
| You can do the same for the Y axis, on the axis Y tab - the ticks and nb Ticks value are automatically computed but you can edit them. Please refer to Vspec user manual for details, this requires some attention... |
 |
| If needed, you can also display gridlines at the labeled graduations |
  |
| To add a title, first enter the title data in the general tab |
 |
| Then go back to the axis X tab and pick the display title options |
 |
| The title is always displayed at the upper right corner |
 |
| To change title location, move the cursor on it, when the mouse pointer changes click on the title to select it. |
 |
| Drag and drop the title to its new location |
 |
| There is a quick way to toggle the display of the graduations, by using the toggle button on the toolabr at the right. |
 |
| Other formating features llike changing font type or size or changing background colors are also available. |
  |
 |
| Finally, never forget to export the result as a bmp file, otherwise all the formating features will be lost at closing spc file... |
 |
| A special formating feature for spectral display is the possiblity to graduate X axis in dopppler shift instead of absolute wavelength. |
 |
| In the Graphic dialog box, in the X axis tab, enter the central wavelength from which the doppler shift will be computed and pick the doppler option. |
 |
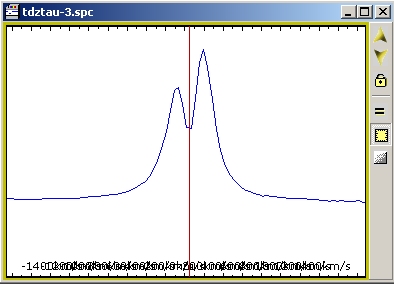
| Sometimes some strange effect can appear as dopppler shift labels are longer than wavelength labels. Go bck and increase the tick and/or nb ticks values |
 |
| When correct spacing is obtained the result is the following: |
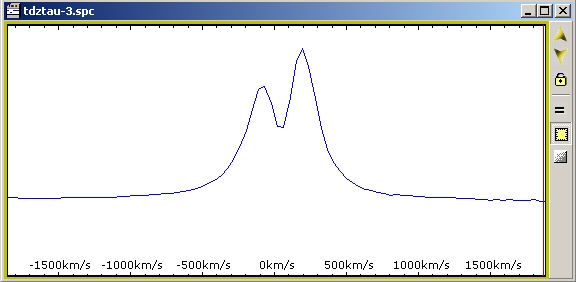 |
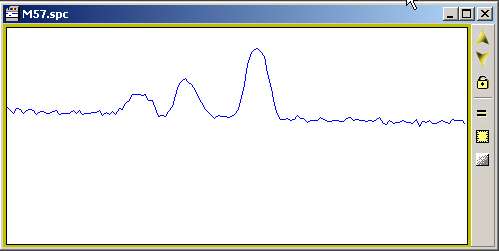
| This function is very demosntrative when looking at speed expansion of a Nova, below is the H-alpha line and it is easy to recognize that the expanding velocity is around 1100 km/s (mid heigh). |
 |
| Another very practical function before exporting the bitmap is a default "User Preference size" for the window size. The user preferences are set in the general tab of the Graphic dialog box |
|
| To automatically set the document window size at the user preference, just click on the user defined size button |
 |
| And the document will be adjusted at the size pre-defined. You can still re-size the document. |
 |
| Formating spectra always the same way is sometimes very fastidious. Some high level automatic functions have been created but they requires some informations to perform correctly. Like the data in the header of each .spc file. Some informations will be extracted directly from the image file, but some will need user entry. There is no issue if the header is not filled correctly, but some automatic functions will not then been possible. |
  |
| As an example, the line "coment" in the header is just a text lines for you to add coments. If you enter the name of the object with some conventions then there is a function wich will retrieve automatically all the .spc files which contains the name string, or any other string.
Step 1 - to call this function you need to click on the "find" button.
Step 2 - Then enter the string with wild char if needed to search in any coment line of spc files.
Select the directory where you want the search to happen, click the all sub-directories option if needed
Step 3 - start the searching process
Step 4 - at the end, all the found files are displayed on the right. you can view the entire coment line by clicking on each of them and even decide t eliminate some from the list
Step 5 - decide if you want to open and normalize automatically the profiles - this is very helpful if you want to compare spectra to each others
Step 6 - Finally open the files...
|
 |
| All the files will be displayed and arranged in the Vspec workspace |
 |
| But they will not have the same format: same wavelength range, or same Y max-min values... Pick one from the list. Select the wavelength range you want to focus, and zoom |
 |
| Now, you can propagate this format change to all opened document by just clicking on Paste Format button |
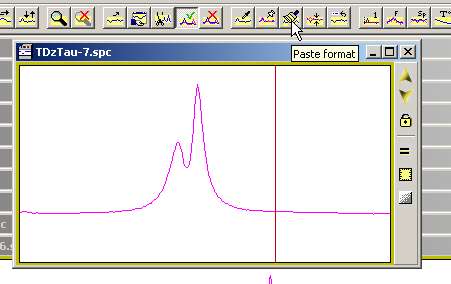 |
| Every profile will have their wavelength range adjusted and their window size adjusted to the one which is currently active |
 |
| To do the same on the Y axis, it is another button "Max Y" - This does not apply the current active profile Y scale to all opened documents. |
 |
| It goes through all opened documents, pick the maximum Y values and apply this value to every ones. This avoid to have some spectrum cut because the wrong value for Y max was picked at the beginning. This was designed to ease spectra comparison over time. |
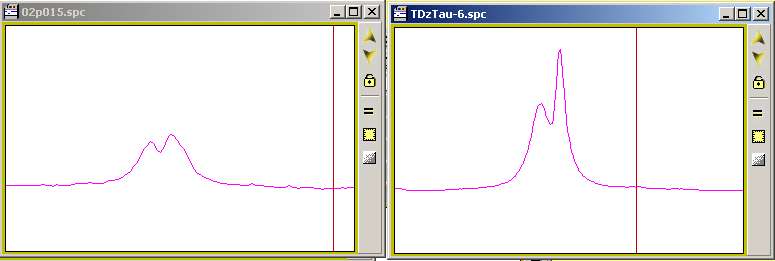 |
| When a lot of profiles are displayed, it is not always easy to retrieve the right ones. Try the "small windows" functions |
 |
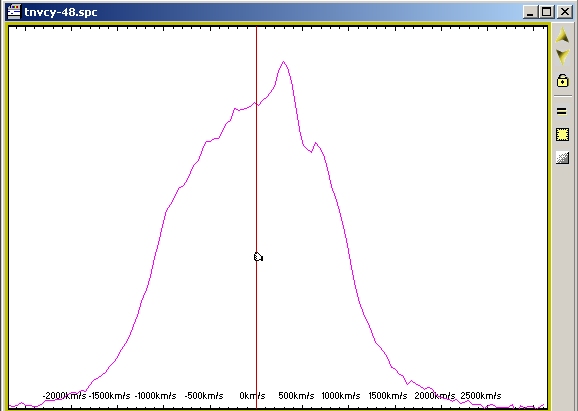
| All opened windows will be re-sized and arranged like thumbnails - below, as the files was opened in the order of time, one can clearly sees the time evolution of the H-alpha line of the Be Star Dz Tau. |
 |