Planetary nebulae 
You can download a M27 spectrum here (using the mouse right click).
Line selection and computation
Once you selected the Plan.Nebulae item in the dropdown box, click on the step 2. We will start with the manual analysis first. The gaussian fit is exactly the same process except that it uses a gaussian fit to compute the EW and intensities.

In the Spectral line section you will have a dropdown list of planetary nebulae which are used to perform computation of temperatures and densities. Your spectrum does not need to exhibits all of them, but he more you have, the more accurate and complete your analysis will be.
Let's start with the He II line. If the line domain is included in the profile Vspec will zoom to it. The zoom factor can be adjusted with the display range value.
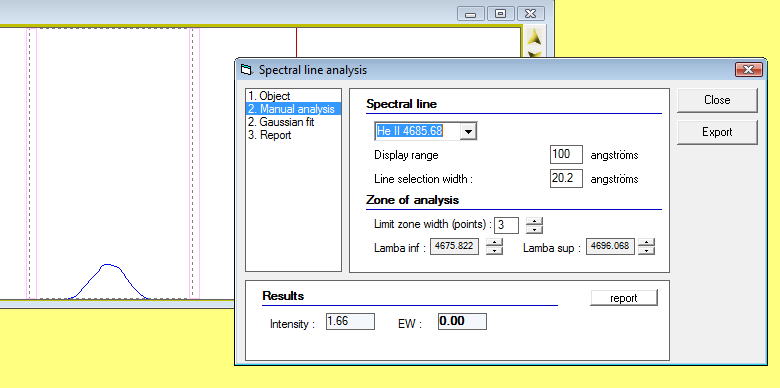
VSpec will then automatically center the selection area to the line at the wavelength indicated, here 4685 Angstrom. If your spectrum is not correctly calibrated the line can appeared shifted. This is not a good indication to go further. The Line selection width value can be modified to include the line but not too much background.

Another value which can be adjusted are the number of pixels will be included to compute the continuum fit. This would depends on how noisy is your continuum. The preset value is 3, changing it will cause the purple rectangle to adjust.

You can modify accuratly then the start and end point of the selection, playing with the up/down arrow next to th value Lambda Inf (start point) and Lambda sup (end point).

As you are adjusting the selection, you can follow in the result section the Intensity and EW values changing. In this example, for Planetary nebulae as the continuum is almost zero, the EW is not computed. All you need are intensity values.
Once you are satisfied with the line selection, go in the results section and store the result in the "report" by clicking on the report button.

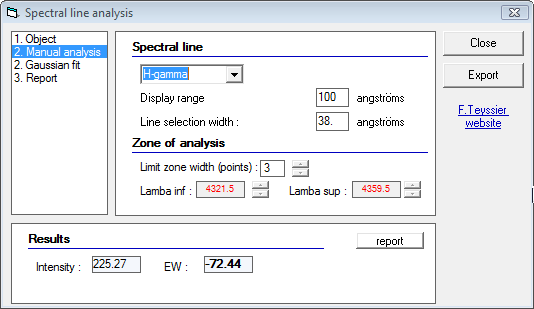
Proceed to the next line... in this example the H-alpha line, check the selection is correct with the defautl parameters. You may not need to readjust them.

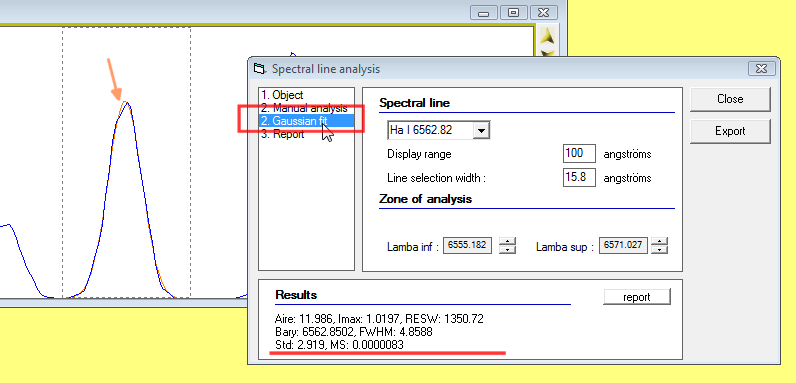
If you prefer to perform a gaussian fit, just select the step 2 gaussian fit and proceed the same way.
If you do not like the automatic selection process, you can simply override it by performing the old way: go in the profile window and click-and-drag to select the line with your mouse.
Report
Each line you stored the results using the report button will have its value stored in the report line list table. To see this table filled, click on the step 3. Report item in the left column. You can return to step 2 and add lines, and check in step 3 the table being filled.

Now comes the fun part... the computation of the physical parameters of the nebulae.
Computation
If you have access to all the listed line (He II lines are not used in this version), then you will have access to all the parameters.
Once lines are measured, click on the Compute button. In this screen capture it is "calcul".

The right columns for each line will be filled. Im(Vs Hb) is the ratio of line intensities in regards to H-beta line. The Ic columns are the de-reddened values, using the expected ratio of H-alpha to H-Beta. Refer to F.Teyssier web pages for a complete explanation.
Now, you may not have access to all the listed lines. Some parameters may still be computationable, with less accuracy, just for your own reference.
... with O [III] lines

... with N [II] lines

... with S [II] lines

... with H lines

Export
You can know decide to save your work and export your analysis.

An explorer window will show up and you can enter the file name of your choice.

The application will automatically launch the application which you associated to .txt file so you can check the report. Most of the time, notepad.exe is associated to .txt files.

Do not be afraid... this file is formatted in a way it can be open with excel, using the coma delimiter and you'll get a much nicer look...

|