Stellar chromospheric activity
By Christian Buil
May 2019

1. Why observe stars chromospherically activity ?
Active regions on stellar surfaces (spots and plages) can be detected by observing the emission reversal in the core of the Ca II H&K lines, respectively centered on 3968.470 angströms and 3933.663 angströms.
Monitoring this H&K core emission, related to non-radiative heating of the chromospheric, is a subject of primary importance in stellar astrophysics. It is not new, but the demand by the professionals astronomers remains very strong today. In fact, it’s easy to understand that chromospheric activity of a given star is changing with time. Large time variations are observed, including times short compared to rotation (flare), rotational modulation at the rotation cycle of the star itself (active region, spot, plage) and long-term variation (similar to the 11-years solar cycle). In the very actual context of exoplanet science, take into account chromospheric activity of the host star can improve photometric and radial velocity measures precision (chromospheric activity can distort these measures and might be misinterpreted as an exoplanet). The concerned stars are similar to the Sun (F, G and K stars).

Example of Ca II H&K emission (star HD 166, B=6.9). Spectrum taken by using a LHIRES III (2400 lines/mm for a R=7500 resolution power) attached to a C9.25 telescope.
The most common indicator of chromospheric activity is the S-index (see Wilson 1968) extracted from medium resolution spectra, and defined by the equation :

were H and K are the flux measured in 1.09 A wide window (FWHM, some authors adopt a 2 A windows) centered on each line of the Ca II doublet, and B and V estimate the « pseudocontinuum » on both sides sides with the flux measured in 20 A wide windows respectively centered on 3900 A and 4000 A. Before, the heliocentric velocity radial shift to be corrected.
The S-index is not the measure of true chromospheric flux emission. Correction are needed: take into account the total bolometric emission of the star and correct the S index from the photospheric emission in the core of H and K lines. The derived new index is named R’HK (see Noyes & all, ApJ, 279, 763-777, 1984).
An chromospheric survey is a typical program where the amateurs can have an important role (multiplication of the observations, long terms survey, reactivity to fast events…). Technically, we have tools and methods for produce a precise job and useful data for the professional community. Detailing (indirectly) the chromosphere of stars with its spectrograph and a small telescope is also a fascinating subject ! That's what I'm trying to demonstrate on this page.
3. A catalog of active chromospherically stars
Chromospheric activity of 2630 stars catalog (Isaacson, ApJ, 725, 875) - not all active stars ! Accessible from :
http://vizier.u-strasbg.fr/viz-bin/VizieR-3?-source=J/ApJ/725/875/table1
2. Bibliography
Here some lectures…
Read for example the classical 1968 Wilson paper (ApJ, 153, 221, 1968) — the first systematic observation of H&K flux by spectrophotometric method, or a more recently, the Baliunas & all 1995 paper (ApJ, 438, 269, 1995).
The Lockwood & all 2007 paper present status of 20-years observation at Mont Wilson - very informative about typical H&K variations on a large sample of stars (ApJ, 171, 260, 2007).
For a sample of active chromospheric stars, see for example Lopez-Santiago & all 2010 (A&A, 514, A97, 2010) (https://arxiv.org/pdf/1002.1663.pdf).
Zhao & all 2013, expose a largeur survey of chromospheric activity for 13 000 stars from the Sloan Digital Sky Survey (SDSS) at low spectral resolution, R=2000 (AJ, 145, 140, 2013).
Boisse & all A&A, 495,959, 2009, an example of paper concerning study of chromospheric activity and research in the field of exoplanets (HD 189733 system).
A spectral subtraction technique for extract the emission, Montes & all (AASS, 114, 287-323, 1995).

A part of the catalog :

For isolate most active stars, select log(RHK) superior to -4.5, for example -4.0.
4. How to observe ?
A resolving power greater than 5000 (near 4000 A) is highly recommended for this program. Under some circumstances (when the spectrograph is very stable) a resolving power of R = 2000 seems to be able to obtain a correct result, even this assertion needs to be confirmed by practice. A signal to noise ratio (SNR) of 100 near 3900 A is a good target for a high quality spectrophotometry and for detect small variations of chromospheric activity.
LHIRES III spectrograph (Shelyak) equipped with 1200 lines / mm grating, but better with a 1800 lines / mm or 2400 lines/mm grating is a fine choice for this program. Note that the holographic 2400 lines/mm grating is very efficient for the UV spectral region (blaze function).
But… we must be careful with this category of spectrograph because the dioptric optical configuration generate a strong chromatic aberration in the near ultraviolet and because precise and reproducible focus in the vicinity of Ca II H&K lines is mandatory.
Here a sample of test spectra on active stars taken by using different spectrographs and telescopes…
Left, a LHIRES III 2400 lines/mm spectrum of the active chromospheric star HD 200560 (C9.25 telescope, exposure 11 x 300 seconds). 35 microns slit wide. The B magnitude of the star is 6.9.
An example of S index measure for HD200560 and for the date:
Signal on K line (2 A integration range) = 23.9 ADU
Signal on H line (2 A integration range) = 22.4 ADU
Signal on V continuum (20 A integration range at 3900 A) = 390.4 ADU
Signal on R continuum (20 A integration range at 4000 A) = 672.3 ADU
So, the computed S-index is 0.436


Left, a possible short time evolution of the activity on the the star HD130848. LHIRES III 1800 l/mm spectrograph on a Celestron 8 télescope (D=20cm). The B magnitude of the star is 6.5.


Up, observation of bright active star HD 200435 (B=4.9). LHIRES III 2400 l/mm on a C9.25 telescope + CMOS ASI290MM camera (very preliminary test of this detector for spectrography).
Up, observation of the faint active star HD 29697 (B=9.1). LHIRES III 2400 l/mm on a C9.25 telescope + ATIK414EX camera (not optimal conditions). Note the very intense emission compared to the continuum level.

An echelle spectrograph linked to the telescope by an optical fiber is very interesting for this type of survey because the spectra obtained are potentially very constant.
Left, spectrum of HD 205435 (B=4.9) taken by using the original version of eShel spectrograph (Shelyak) with a resolving power close to R = 10000. This version suffers from two defects which however degrades the performances: (1) a strong chromatism in the blue and UV wavelengths which forces to refocus to obtain a sharp spectrum near the H&K lines (problem equivalent to the LHIRES III), (2) a low radiometric efficiency near H&K. As we see in the left, it is still possible to obtain correct results on relatively bright objects.
I intensively worked on the improvement of the eShel spectrograph between the years 2017 and 2018, precisely for the specific purpose of increasing its performance to realize this chromospheric star observation program, which is the subject of this article. Thanks to the use of an optical fiber optimized for the blue part of the spectrum, a collimator lens recomputed with special glasses, the use of a new camera objective (Canon 135 mm f / 2 L) associated with a camera with a low noise (1.3 e-) large CMOS sensor and an optimal spectra extraction procedure - the spectrograph is now significantly more efficient. By using an RC10 telescope (D = 25 cm) and an exposure time of one hour (4x900 s) at the wavelength of 3900 A, the magnitude B = 7.2 can be reached with a signal-to-noise ratio of 100 and the magnitude B = 8.3 with a signal-to-noise ratio of 50. The current limit wavelength reached in blue is 3780 A (order 59). Shelyak is able to provide this optimized eShel (2) version.


Up, eShel(2) observation of chromospheric active star 61 UMa (B=6.1). Measured spectral resolution power is R=12000. Telescope RC10 f/8. Camera ZWO ASI1600MM (at T=-20°C).
Up, same setup used but for a faint very red flare star (type M1.5), CR Dra (B=10.2). The SNR on the continuum is very poor, but intense H&K emission can be detected.


At left, full spectral range of CR Dra spectrum captured by using eShel(2) spectrograph (note the relative intensities of H&K lines). At right, detail of D1,D2 Na I and Halpha lines.
Below, for the H&K spectral domain, a comparison between CCD camera (Atik460EX) and a CMOS camera (ASI183MM, blue quantum efficiency improved detector, see test here). The active star HD130048 observed by using a RC10 telescope and eShel spectrograph :

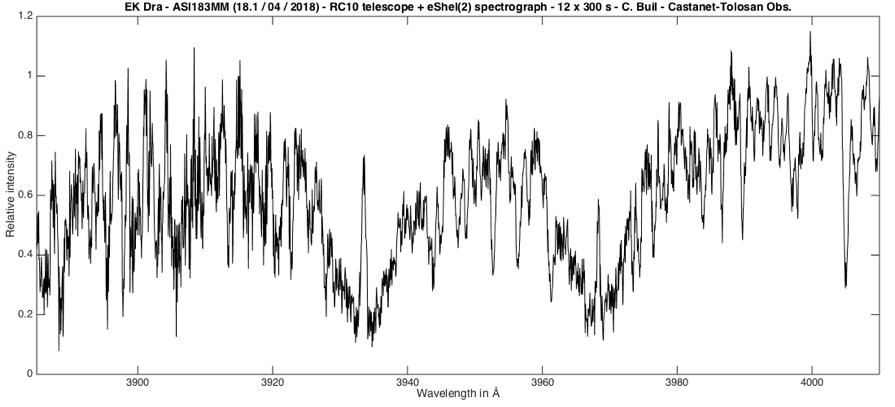
A CMOS ASI183MM camera on eShel spectrograph for a more faintest star, EK Dra (B=8.2) :
Detection of chromospheric activity seem also possible at low spectral resolution. See the example of the SDSS survey with a resolving power of R = 2000 (Smee & all, AJ, 146, 32, 2013). To demonstrate in practice, I used the UVEX spectrograph (UltraViolet EXplorer), well adapted because perfectly achromatic over a very wide spectral range (usable down to the atmosphere cutoff, around 3250 A). I select the most resolving configuration (1800 lines / mm, 23 microns slit). Next, comparative example on 61 UMa between eShel and UVEX :

Presence of chromospheric activity can be observed on UVEX data, but with a precision TDB (To Be Defined). In the over side, UVEX(3) can capture spectra with a SNR of 100 @ 390 nm for 1-hour exposure by using a 25cm f/8 on B=9.2 stars (1800 grooves/mm grating).
5. A first list of target
Alexandre Santerne, Laboratoire d’Astrophysique de Marseille (Aix - Marseille University, France), involved in the observation of chromospherically active stars for it’s works around exoplanets, suggests a first list of stars to observe. All these targets are known to be bright, member of the main sequence and very active :
HD 166
HD 20630
HD 22468
HD 37394
HD 41593
HD 114519
HD 115404
HD 131156
HD 146361
HD 200391
HD 210334
HD 220140
HD 224085
Once you get your hands on these targets, Alexandre suggest an equivalent list, but rather inactive. If possible, targets should be observed with a resolution of the order of or greater than 10,000 by covering the spectral range between (at least) 3880A and 4020A. It is useful to make time series over several nights to see the variability associated with stellar rotation.
Below, observations of a sample of Santerne’s stars (note the diversity, for example the double-peak emission for HD146361), and, for example, a very instructive comparison between author data and Jean Pierre Masviel data…
The C. Buil’s setup: a Schmidt-C Cassegarin 9.25 Celestron telescope (D=23.5 cm, F/10), a LHIRES III 2400 grooves/mm spectrograph + 35 microns clear slit, for a R=6000 @ 4000 A), a CMOS camera ASI183MM pro.
The J.P/ Masviel’s setup: a Maksutov INTES D=15.0 cm, F/10), a LHIRES III 2400 grooves/mm spectrograph + 19 microns standard slit for a R=12000 @4000 A, a CCD camera ATIK314L+.


More…


