

The theory
Grism
assembly
Applications
Compared
efficiency of some gratings
An
optimal grism
KAF-0401E
spectral sensitivity
In this section a technique is described for acquisition
of pointlike objects downto the 17th magnitude using a 16 inch class telescope.
The application field would be to study low resolution supernovae spectra,
but many other object types would be within reach of the rudimentary spectrograph
proposed here, such as comets, planetary nebuale or quasars.
In order to achieve this goals, the diffraction grating is located directly
in the telescope's converging beam, close to the CCD's sensitive surface.
With regard to optical aberrations, this is not the best design to be considered
(further on we will see some improvements). But such an arrangement provides
for an extremely simple and efficient instrument, often called a "field
spectrograph" or "imager spectrometer", that can be used on weak objects.
A spectrograph's R resolution parameter is the ratio between
wavelength l and the spectral separation
power at this wavelength, Dl
 Our modest spectrograph will allow us to reach R=50 to 100, while some
professionnal slit spectrographs have a resolution in excess of 30,000.
However, with this modest resolution, our spectrograph will deliver more
usable information than images made using e.g. a set of BVRI filters (10
times as many spectral channels since a filter in a BVRI system typically
has a half-height width of 1000A).
Our modest spectrograph will allow us to reach R=50 to 100, while some
professionnal slit spectrographs have a resolution in excess of 30,000.
However, with this modest resolution, our spectrograph will deliver more
usable information than images made using e.g. a set of BVRI filters (10
times as many spectral channels since a filter in a BVRI system typically
has a half-height width of 1000A).
Figure 1 shows the grating's position in the optical beam. Depending
on wavelength, polychromatic light from a field star is spread differently
when going through the array. Hence a spectrum appears in the CCD's plane.
Each field object has its own spectrum: stars, galaxies...
Figure 1. Disposition of the grating
in the telescope's converging beam.
The deviation angle for a given wavelength light ray is given by:
 In this formula a is the angle of the
incident ray respective to a line normal to the surface of the grating,
b
est the angle of emergence after diffraction,
m is the number of
ruled grooves per millimiter (in general,
m is comprised between
50 and 1200 grooves/mm),
k is an integer number for the spectrum
order and
l is the wavelength in millimeter.
In this formula a is the angle of the
incident ray respective to a line normal to the surface of the grating,
b
est the angle of emergence after diffraction,
m is the number of
ruled grooves per millimiter (in general,
m is comprised between
50 and 1200 grooves/mm),
k is an integer number for the spectrum
order and
l is the wavelength in millimeter.
If on average the incident beam is normal to
the surface (as is the case in figure 1), then a=0,
and we obtain a simplified version of the previous formula:
 Let us assume that the grating has 100 grooves per mm and that we are studying
the path of a ray at a wavelength of 0,65 micron or 0,65.10-3
mm. For k=0, obviously
b is 0 whatever the observed
wavelength. This means that through the grating we observe a direct, polychromatic
image of the object, with no deviation.
Let us assume that the grating has 100 grooves per mm and that we are studying
the path of a ray at a wavelength of 0,65 micron or 0,65.10-3
mm. For k=0, obviously
b is 0 whatever the observed
wavelength. This means that through the grating we observe a direct, polychromatic
image of the object, with no deviation.
For k=1, angle b is given by
 For k=-1, we find a deviation angle of 3,7°. This means that on either
side of the 0 order we find two identical spectra.
For k=-1, we find a deviation angle of 3,7°. This means that on either
side of the 0 order we find two identical spectra.
It can easily be verified that for larger values of k other spectra
appear symetrically, farther from the 0 order image. In good quality gratings,
grooves are given a shape that concentrate most of the light in a given
order different from 0 (this is the grating's blaze angle).

Figure 2. The diffraction of an HeNe
laser's beam when passing through a grating. The screen shows as
many monochromatic images of the beam as there are orders. One of the images
is much brighter than its neighbours, indicating approximatively the blaze
angle (note that this is not the zero order).
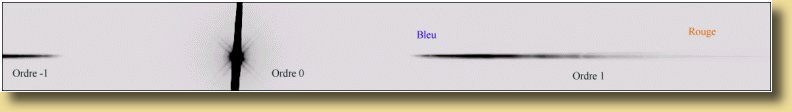
Figure 3. On either side of Vega's
zero order image (saturated here, hence the vertical blooming streak),
are spectra of orders 1 and 1. Further on higher orders can be found,
but they are too weak to give a clear visible signal in this CCD image
reproduction. This observation was obtained with a #40 Cokin grating, and
an Audine camera with a KAF-0400.


