R Leonis is a red giant of Mira Ceti type. It is a different kind of giant star in comparison with Betelgeuse. The latter is a very massive star evolved in a supergiant (luminosity class I) destined to explode in supernova. Originally, R Leonis was a Sun-like mass star - it is currently less massive than the Sun. It is at a very late evolutionary stage called thermal-pulse asymptotic giant branch, a stage that leads the star to periodically skrinks (and brightens, because it then gets hotter) and expands (and dims, because it cools) in a period of around 300 days. Its final fate will be a planetary nebulae. R Leonis is quite representative of our Sun's final fate, that will happen in around 5 billions years.
Visually,
the star is a marvel to observe. Contrary to Betelgeuse that, despite
being classed as a "red" supergiant, largely appears orange to the human
eye, R Leonis really looks red at the eyepiece. This is because it
spectral type is a much "later" type, M8, while Betelgeuse is M2, and
its luminosity in blue and green is extremely low, while it is bright in
red, and very bright in infrared.
As
of April 2019, I have made only one observation of that star. It was
observed on April 20th, at a period when it was in its expanding phase
and rapidly dimming. R Leonis is visible with naked eye at its brightest
(+4,3) but like Mira can dims down to a very faint magnitude of +11,
when it will require a telescope to be detected. At the end of April, it
was around its average magnitude of +7/+8.
The
goal of the observation was essentially to reduce the spectrum of the
star into BVRI magnitudes. Especially, I was interested in comparing the
R and I magnitudes to the SIMBAD values, since there was an important
discrepancy between them and my results when I observed Betelgeuse.
Fortunately, to the contrary of this last star, the AAVSO do provides
references for R and I and we will see that the comparison is fruitful.
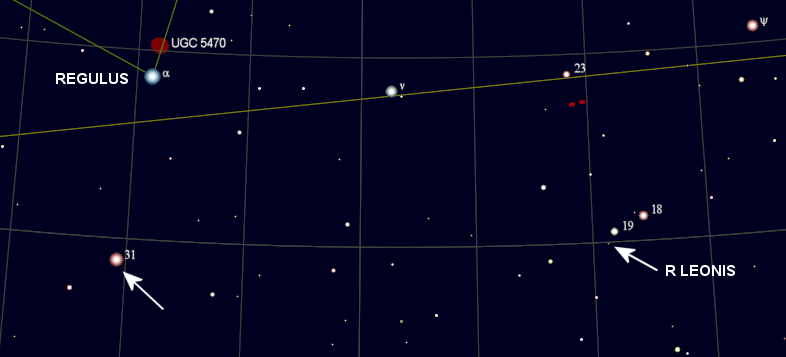
The same method than for Betelgeuse was used: find a comparison star, and wait until the two stars can be observed at the same elevation. The star I used for comparison is 31 Leonis, an orange giant (K4III) that provides reliable BVRI photometry both from Simbad and the AAVSO. 31 Leonis is easy to find just south of Regulus:
Here
are the two corrected spectra of 31 Leonis (left) and R Leonis (right).
Superimposed are real color images taken with the ASI224MC camera. These
spectra have been corrected this time by using an instrument efficiency
calculated with a spectrum of Regulus, much easier to process (blue
star).
 |
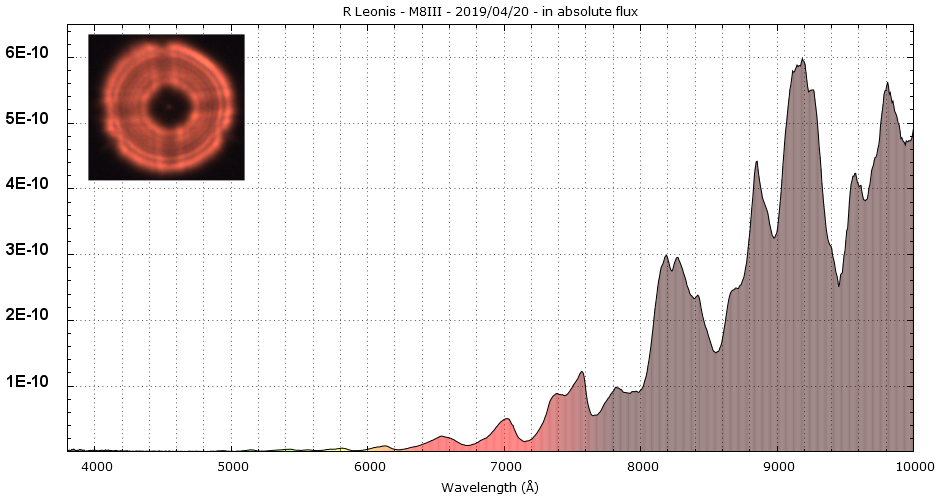 |
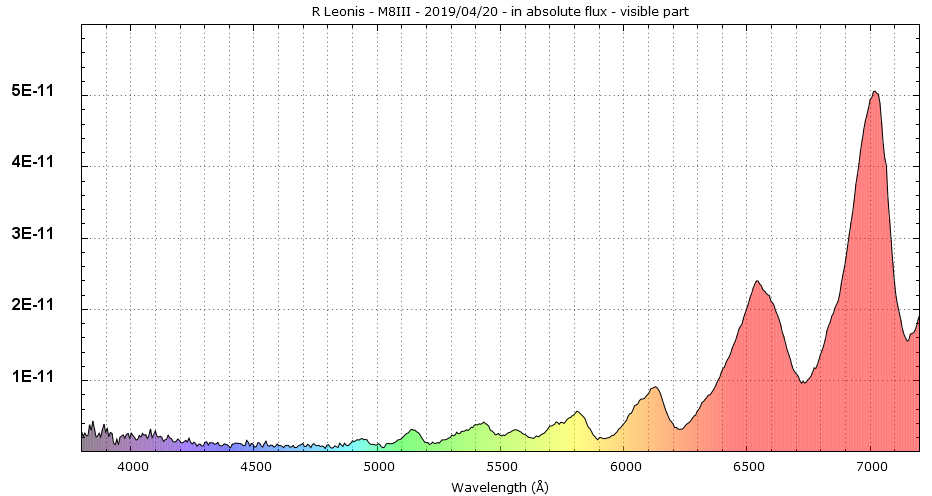
As we can see, the brightness of the star is overwhelmingly dominated by infrared wavelengths! Here is a detailed spectrum centered on the visible part, because it is too faint to be clearly visible in the full spectrum:
Photometry
of R Leonis
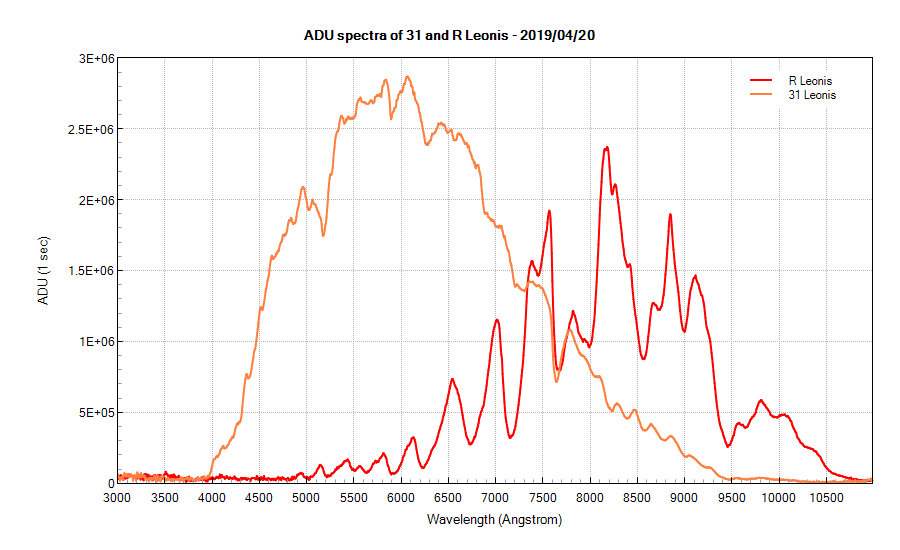
Below
are two graph presenting: the ADU spectra of R and 31 Leonis, that will
be used for photometry. At right, the same spectra but expressed in
absolute flux. The two curves are at the same relative levels on each
graph (look where they are close to each other) and this means that the
airmass factor has been eliminated as it was expected.
 |
 |
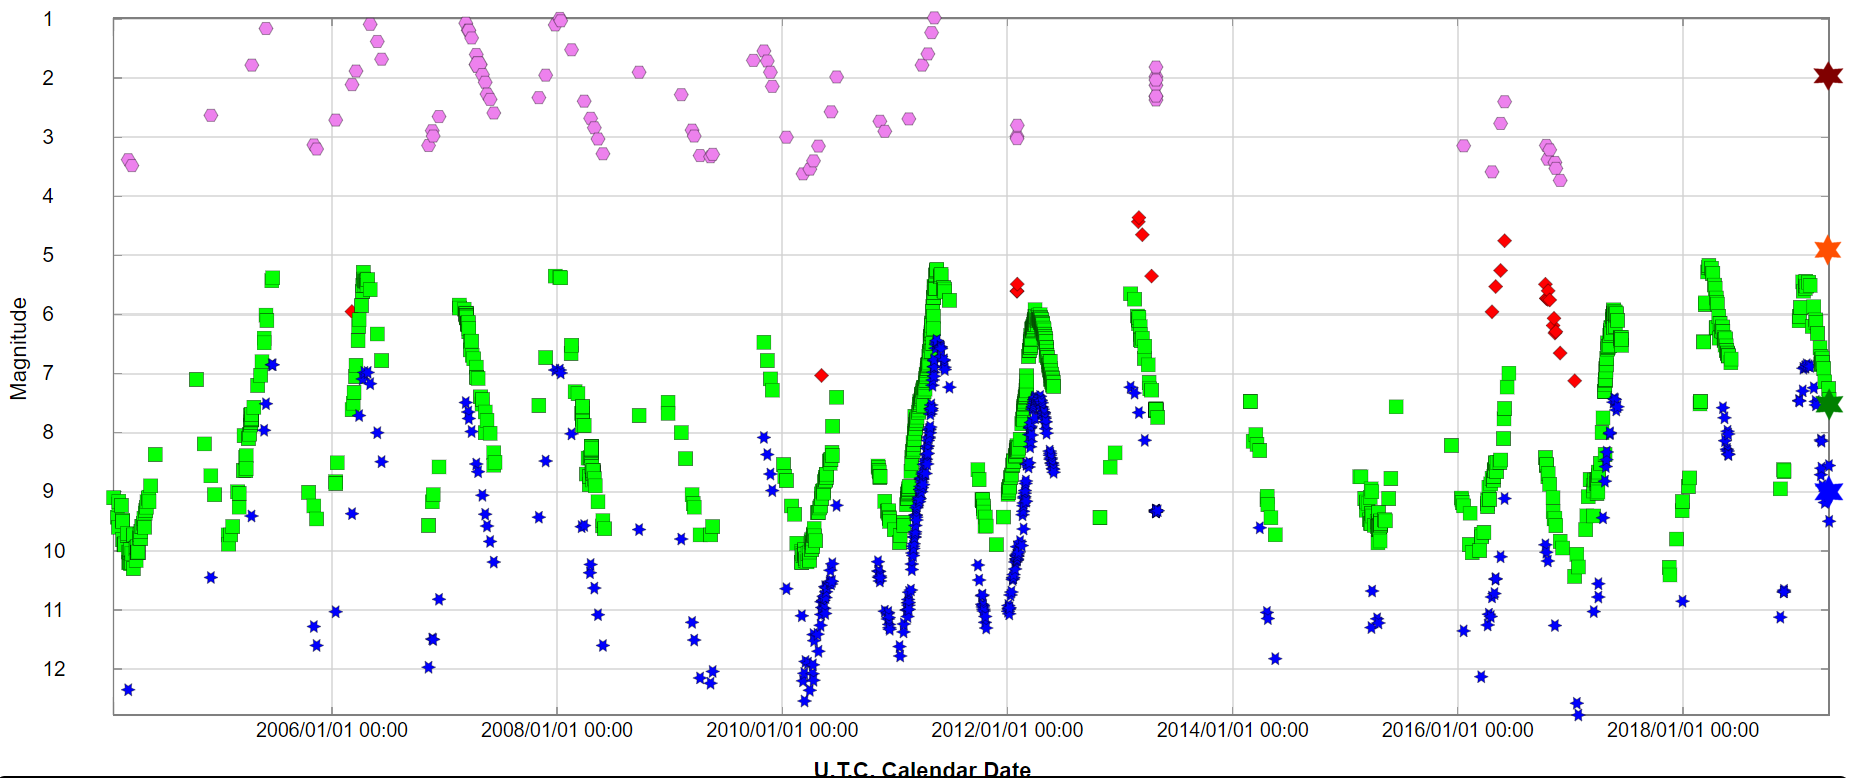
Now
here are my BVRI results. The value of the V mag was +7,56 for me on
April 20th, 2019, a value very close to the +7,53 mean value provided by
SIMBAD. This allows a direct comparison with the catalogue magnitudes.
The accordance is good also for B (+9,06 / +8,94), but the discrepancies
for R (+4,89 / +3,39) and I (+1,96 / +0,12) are huge ! However, when
comparing the values provided by AAVSO observers, it looks that my R and
I magnitudes are largely coherent. The graph shows a mean R magnitude of
around +5 when V= +7,5 and of +2 for I. This comparison leads me to
think that the discrepancies found in R and I for both R Leonis and
Betelgeuse don't come from an erroneous personal method, but from
something else. It would be interesting to check how the SIMBAD values
were calculated - they come from the same professional article.
My
V and B values for April 20th are in the move of the AAVSO curve for
that date (see the very right end of graph).