|
|
|
Last Modified:
email dave@allmon.com |
|
|
|
|
|
|
Description of test
|
|
|
The test fixture is made from a cardboard shipping tube large enough in diameter to cover the front of the camera. The tube is painted inside with Krylon Ultra Flat Black paint. One end of the tube has a black mask inserted. This mask has a 1" square hole in the center. The other end of the tube has another mask inserted about 3 inches into the tube, creating a chamber. This mask has a 1" round hole in it. The chamber created by this mask is painted with Krylon Flat White paint. The 1 inch diameter hole is covered with two layers of velum, creating a diffuser. The distance between this diffuser and the front of the CCD at the other end of the tube is 40 inches. The chamber contains an unregulated halogen lamp.
The video amplifier is strapped for unity gain, and the scope lead is connected to pin 2 of the CCD. The camera to tube interface is shielded with black cloth and tape. |
|
|
|
|
|
|
|
|
|
|
|
|
|
I made two reference exposures. One was a bias frame, taken with the shutter closed, and without external illumination. The second frame was a 0.25 second frame taken with the shutter open, and no external illumination. These may come in handy - I don´t know.
I then made 10 frames with exposure times from 0.25 seconds to 2.50 seconds in 0.25 second intervals. The frames were looked at with Pisco to determine the mean, median, standard deviation, minimum and maximum values for the entire frame, minus the outside four to six pixels. These frames are stored as FITS files, and are available if needed.
During each frame readout, I photographed the oscilliscope display. After the readout was complete, the statistics were recorded. These statistics were then superimposed on the associated oscilligram. The readings may not match the oscilligram image exactly, since the readings are taken from the full image, and the oscilligram may be taken at various times throughout the readout. |
|
|
|
Bias |
|
|
Bias frame taken in darkness with the shutter closed. The only signal should be the dark signal for a readout time from <1 mS to 16 seconds. |
|
|
0.25
Dark |
|
|
0.25 second dark frame. The signal should be that of the above frame plus 0.25 seconds of dark signal. |
|
|
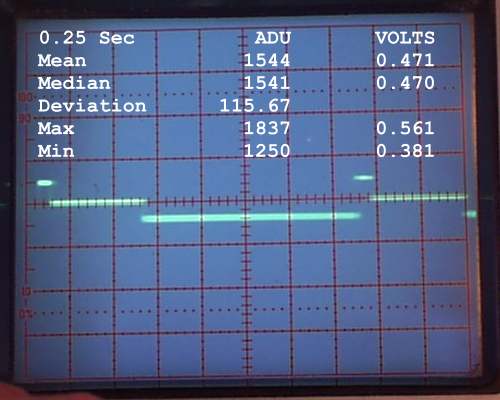
0.25 |
|
|
0.25 second light frame. See the image for particulars. |
|
|
0.5 |
|
|
|
0.75 |
|
|
|
1.00 |

|
|
|
1.25 |

|
|
|
1.50 |

|
|
|
1.75 |
|
|
|
2.00 |

|
|
|
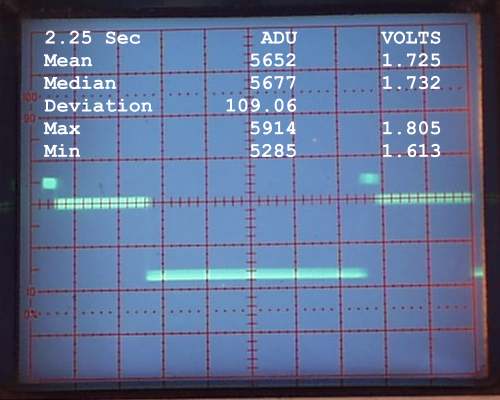
2.25 |

|
|
|
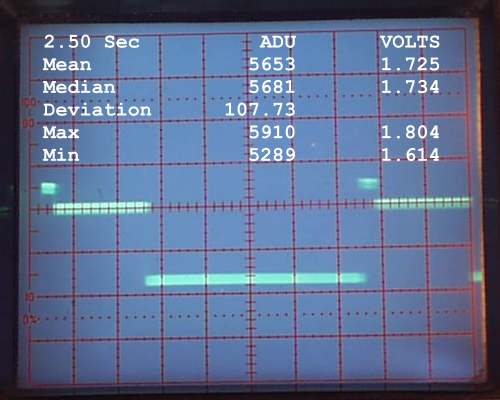
2.50 |

|
|
|
|
|
|
The data in tabular format:
|
|
|
|
|
EXPOSURE |
MINIMUM |
MAXIMUM |
MEAN |
MEDIAN |
|
0.00 |
567 |
895 |
709 |
707 |
|
0.25 |
1250 |
1837 |
1544 |
1541 |
|
0.50 |
2002 |
2723 |
2372 |
2376 |
|
0.75 |
2713 |
3663 |
3210 |
3231 |
|
1.00 |
3395 |
4376 |
3986 |
3991 |
|
1.25 |
4154 |
5061 |
4693 |
4709 |
|
1.50 |
4794 |
5740 |
5529 |
5149* |
|
1.75 |
5133 |
5902 |
5575 |
5637 |
|
2.00 |
5291 |
5913 |
5653 |
5683 |
|
2.25 |
5285 |
5914 |
5652 |
5677 |
|
2.50 |
5289 |
5910 |
5653 |
5681 |
|
|
|
|
* NOTE: I think this reading is bogus. |
|
|
|
 |
|
|
|
This is a graph of some of the data from the test. Only the maximum (red), mean (green), and minimum (blue) values are plotted. It looks like the first pixels reached saturation in 1.5 seconds, with a median ADU of 5637, which corresponds to a CCD output voltage of 1.72 V. The maximum output in that sample was 5902 ADU, or 1.801 V. The highest pixel reading during the test was 5914 ADU, or 1.805 V.
|
|
|
To determine the blooming point I taped a horizontal slit across the center of the CCD window, and illuminated it with a slit at the diffuser. This produced very sharp horizontal edges in the image. I then increased exposure time until the edge broke down visibly. The mean value of the illuminated area near the breakdown was taken as the blooming point. |
|
|
|
 |
|
|
|
This graph shows the ADUs logged per 0.25 seconds during the course of the test. In a perfect world, this would be one straight horizontal line. In the real world, the sensor has irregularities, the wells are of finite depth, and my test is flawed. It does show that the sensor tended to be linear up to 1.5 seconds, at which point all of the wells filled, and saturation occured. In a better test the sensor would likely show deviation smaller than the width of a line on the graph. |
|
|
|
|
|
|