specINTI & specINTI Editor
specINTI V 2.5.1 - specINTI Editor V1.3.7
March 12, 2024

by Christian Buil and Valérie Desnoux
Summary :
1 : specINTI et specINTI Editor, what for ?
3 : How do I read this documention
4 : specINTI spirit
6 : Process your first spectrum with specINTI
7 : Detailed processing of spectra with high spectral resolution
8 : The low resolution spectrography
9 : The infrared spectrography
10 : In the privacy of the observation file
12 : The special modes
12 : Parameters reference manual
13 : Functions reference manual
14 : Ressources
Appendix 1: Lab’Ex application
Appendix 2: Pol’Ex, the Pollution Explorer
Appendix 3: Spectral lines atlas
1 : specINTI and specINTI Editor, what for ?
specINTI, together with its extension specINTI Editor, is a software designed to process spectra of light sources captured with a grating spectrograph. The application is primarily designed for the spectra of astronomical objects, but the field of applications is much wider due to the flexibility of the tool. Moreover, the use is not tied to a particular material. For example, if you come from the world of astronomy, spectral data from spectrographs as diverse as Star'Ex, UVEX, LowSpec, Lhires III, Alpy 600, LISA can be perfectly managed by specINTI.
This manual will teach you how to use specINTI through the graphical interface specINTI Editor, which makes it easy to use.
specINTI and specINTI Editor are free software and can be used free of charge, except that you must keep the copyright mention. These applications are entirely written in Python language, but currently only distributed as directly executable files for Windows, macOS, Linux platforms. Installation is very simple, no need to use Python and to be a programmer.
The specINTI application is at the heart of the system - it contains all the processing functions - but it is not advisable to use it directly when starting out (it works without an interface, which can be confusing). For sure, you will go for a more classical graphical interface. This interface, called specINTI Editor, establishes the link between you and specINTI. It allows you to edit "parameters" which are then transmitted to specINTI through a simple text file. This organization offers the possibility to make specINTI and specINTI Editor evolve in a completely independent way. For example, you could write your own version of specINTI Editor that uses the functions of specINTI. In this documentation we will only focus on the Windows version of specINTI Editor (knowing that the macOS version is very close).
2 : specINTI Editor installation
How to install specINTI Editor for Windows

1. Download the ZIP archive containing the software and associated files from (V2.5.1): specinti_editor_en.zip
2. Unzip the ZIP archive in the folder of your choice on your storage system.
3. You end up with two folders and two executable files:
- The file specinti_editor.exe, which is the program itself. You can create a shortcut to it on your desktop.
- The file specinti.exe, which is the "core" version of the software, without the interface. You can ignore this file (this version must be launched from a command line by typing: specinti configuration, the parameter being the name of a file driving the program).
- The "_configuration" folder, which contains a set of sample configuration files for running specINTI, and to which you will add your own configurations, according to your own use of the software. It is imperative that the "_configuration" folder is present in the folder containing specinit_editor.exe, otherwise the program will not start.
- The "_internal" folder contains all the libraries needed to run the software.

Note: In the event of a "major" update, remember to copy the current "_configuration" folder, which contains your favorite workarounds and other utilities, to a safe place. Then copy the "_configuration" file you've moved to the directory containing the update. For a "minor" update, you may only need to copy the "specinti_editor.exe" file to the software directory.
4. Click on "specinti_editor.exe" to start the program. For first-time users, it may take several tens of seconds for the interface to open. After that the process is much faster. It's important to note that a second window will open at the same time, in which the software will write information during the calculation process. Please note that this console window may be hidden behind the interface window. When you use it for the first time, error messages may appear in the console. Ignore them most of the time:

This is how the specINTI_Editor. Exe interface at startup (this may vary according to version):

How to install specINTI Editor for macOS ou Linux

Go to this link to find the installation procedure and files for macOS and Linux: specinti_macOS_Linux.
3: How do I read this documentation?
This documentation is organized by major specINTI_Editor usage themes, such as low spectral resolution and high spectral resolution. However, a linear reading is recommended to get the maximum information and usage tips.
With practice, you will often refer to the reference manual.
Another important document to read is the software's toolbox, which comes as a PDF file you can print out and which will certainly be a good memory aid (many thanks to David Trowbridge for the English translation): specINTI_Editor tools English.
2 : The specINTI spirit
Do not trust the first impression, insist a little. Underneath a somewhat "gruff" appearance, this application will do you a lot of good, but you have to accept the stripped-down approach, which breaks with the current standard of user interfaces, often loaded with buttons and long menus. Here the key word is sobriety, which does not exclude power. In addition, it is also necessary to accept to read the present manual, which is also a small illustrated course of applied astronomical spectrography, which will prove useful in all circumstances.
The specINTI software, for the processing of spectra, is the equivalent of INTI, for the processing of solar images acquired with the Sol'Ex instrument. These softwares are developed in the context of the Sol’Ex/Star’Ex projects, in order to propose accessible and efficient tools, as are also the Solar Explorer and Star Explorer instruments
The "specINTI" engine, in order to work, must be fed with parameter values which are transmitted to it as soon as one wishes to process spectra. The decision to use or not such parameters, and the value of these parameters, is your responsibility. Everything is centralized in a single file, called "configuration file", which you can write with a basic text editor, or better, with the help of a graphical interface, namely the "specINTI Editor" application. Here you can see the real physical separation between the processing engine, specINTI, and the interface, specINTI Editor.
Think of the configuration file as a "style sheet" as found in some word processing applications. You have some freedom to organize the parameters in this file, to customize your way of working, but you still have to respect a syntax. You will find in this distribution of the software some examples of configuration files, adapted to rather general observation situations, described in the following. Think of these examples as templates on which you can base yourself to adjust the treatments for your own situation (type of spectrograph, type of celestial objects...). Copy/paste will certainly be your friend in this task.
3 : What is a spectrum?
To help you get started with specINTI Editor, you can download raw acquisition data from a number of observation nights. Internet links will be regularly provided for this purpose. You will thus enter the big bath in the best way possible, by being confronted with real data, which you must be able to process (we will guide you!). No doubt that your own observations will resemble those we propose as examples.
But by the way, what is a spectrum and what is the purpose of this famous processing of spectra of astronomical objects?
At the beginning we have images that look like those of the deep sky, except that the device continuing the spectrograph transforms the usual point image of the stars into a line of light covered with the colors of the rainbow. This is the spectrum. To some extent, think of the spectrograph as a super color filter, whose transmission wavelength you can control. If the sensor used in your camera is capable of showing the "true" colors, at the very moment of observation you will see them appear on your computer screen. They are pure and magical, and you will quickly notice that your dear stars, rather than being anonymous points, this parent of hues offering much more than we think too often.
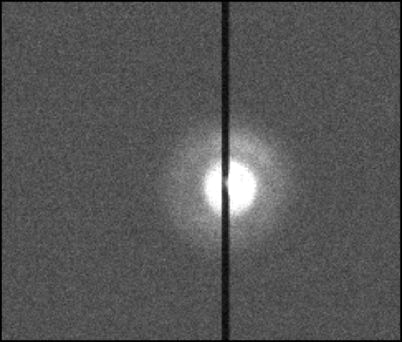
A little demonstration as an appetizer. At first, nothing fundamentally distinguishes the shooting of an image of deep sky objects and planets from the shooting of a spectrum of these same objects. In both situations, you need a camera to transform the photons coming from the sky into an electronic and then digital signal, you need to point your object in the sky, you need to focus it to make its image sharp, you need to make exposures to the light more or less long, you need to guide on your target if necessary (manually or automatically). On the left an image of the planetary nebula NGC 2392, called the "Owl" as seen during the acquisition of its spectrum using a Ritchey-Chretien telescope of 254 mm (f/8). The image is delivered by the pointing/guiding system of a Star'Ex spectrograph (but all models work in a similar way). The sharpening is done in the plane of the pointing camera in a very traditional way. On this 30 second exposure, obtained with an ASI178MM (ZWO) camera, we can see the extended disk of the nebula. A subtlety to note: the presence of a vertical black line that bars the image of the nebula. This is the image of the entrance slit of the spectrograph in "shadow", the opening through which the part of the nebula whose spectrum we want to take enters the spectrograph. It is narrow, here 23 microns wide, but very high, so that we realize the spectrum of a "slice" of the nebula, a kind of section of it. A big positive point for spectrography: if your equatorial mount or AltAz guides poorly, if there is wind, this does not have a major impact when taking spectra (except for a loss of signal that is compensated by exposing longer), while your deep sky image may be ruined in the same circumstances. In fact, it is much easier to make spectra of sky objects than images of them!
Hereafter, images showing the result of the spectrum of the nebula NGC 2392. More precisely, we display two representations, one in color and the other in grayscale :

On top, the spectrum as it is rendered by a camera equipped with a color sensor after a few minutes of exposure. The horizontal line is the spectrum of the central star of the planetary nebula. We can see the intensity of light change according to the color. The whole purpose of spectrography is there: to record the distribution of this intensity as a function of wavelength. From there, all our knowledge in astrophysics is derived, from the composition of stars to the evidence of the expansion of the universe. As amateurs, you can now replay these observations, which make the history of astronomy, but also be the actor of discoveries still today so rich is the message carried by light when it is exploited in this way.
It is common to represent the direction of the colored dispersion along the horizontal axis (it is the "spectral" star) and to show the blue on the left and the red on the right. In this example, the entire photovisual spectrum is captured at once, from blue to red.
Below, the same spectrum, this time captured by a detector showing only levels of gray intensity. If the standard is respected, and if one has a little imagination, one can represent the colors despite everything. The star is located in a nebula, the spectrograph simultaneously seized the spectrum of the latter, which is presented in the form of a bar code, "spectral lines", whose presence reveals the chemical composition, temperature and density of the nebula, among others. The vertical axis is called "spatial" and represents a slice of the nebula, precisely located by the entrance slit of the spectrograph.
This colored spread of starlight (and nebulae) is also called "spectral dispersion". As we have just seen, taking spectral images with a telescope is quite similar to that used to capture a classic star field. We do not even forget the traditional offset, dark, flat-field. In short, if you know how to take images of the deep sky, you already know how to acquire images of the spectrum of celestial objects.
Then comes the moment of processing the data thus obtained. The first step is a classical pre-processing, which exploits the offset, dark and flat-field images if they are available. This is of course a task that specINTI performs perfectly automatically.
Often in deep sky imaging, you are led to add images of the same field together to improve the quality of the final result, by reducing noise for example. The same is done with spectra images (but the processing is simpler, easier to automate and more accurate).
The final processing step is called in technical jargon, a "data reduction" or simply "reduction". In other words, we are going to reduce a large volume of raw data into a really understandable data for exploitation. In deep sky imaging, this may be a nice composition, with a careful framing, and sometimes a colored rendering that matches your taste. In spectrography, we will look for the intensity of the light coming from the star as a function of the color, or wavelength. Since tables of numerical values are rarely meaningful, a more aesthetic and understandable aspect is sought, in the form of a curve, which we call "spectral profile". Unfortunately, amateurs often give up at this point. The so-called mathematical abstraction of a curve, which can bring back bad school memories, is a reason to surrender in the open field. What a pity, so close to the goal! This is indeed where the treasure of our work lies and where the exciting things come to light. Consider the curve below:

It is now a question of a spectrum, drawn from images of a very particular object, of magnitude 12, the microquasar SS433 (the telescope used is a simple Celestron 8 operated in town). Let's take note of the location. The horizontal axis is that of wavelengths (in angstroms, the unit still widely used in astronomy, 1 A = 0.1 nanometer). The vertical axis is that of the intensities (in relative values, that is to say without associated physical unit, it is the simplest).
The curve reveals that the object produces an intense light in the red part of the spectrum, a little beyond the wavelength 6500 A (precisely, 6563 A). This light emission is concentrated in a restricted wavelength range. It is a spectral "line" (in emission). Its origin is hydrogen, the atomic species very largely dominant in the Universe. This red light comes from a ring of gas strongly heated around one of the two stars of a tight double system. But the most astonishing thing is not there: we notice peaks on both sides of the large line. Again, hydrogen is the responsible chemical element, but the position of the lines is not at all at the expected position in the spectrum. The localization of these details indicates that the matter which is at the origin moves at a speed reaching the third of the speed of light, 75000 km/s! Nothing less. It is thanks to an effect well known in physics, the "Doppler-Fizeau effect" that we are able to measure simply and precisely these speeds, from our curve. To tell the truth, we see a jet of matter emitted at a relativistic speed (close to the speed of light) by one of the components of the couple, which initially attracts the matter of its neighbor. The object responsible for this jet is very massive and compact, we suspect a black hole located in our own Galaxy. Try to deduce all this from the point image of SS433 taken in standard photographic mode... It is impossible. In truth, we have obtained a true image of the object, but in 3 dimensions, revealing these extraordinary properties... by drawing a curve. One more thing: if a spectrum is taken the next day, it will certainly have changed shape, because the object is rotating and it is eruptive. The unchanging and fixed sky does not exist in spectrography!
To get closer to the philosophy of specINTI and specINTI Editor, let's process a night sample from a set of pre-established parameters, without worrying about the details for the moment.
4 : Process your first spectrum with specINTI
In order to get a concrete idea of how specINTI works, we propose a very simple experiment. Start by downloading a ZIP archive, in which you will find the raw data of a typical spectral observation session. To do this, click on the following link: starex213.zip
The name of this archive specifies that it is the observation number 213 realized with a Star'Ex spectrograph of one of the authors. It is the result of one night of observation (one part to tell the truth). The spectrograph is equipped with a 35 micron wide slit, a 2400 lines/mm grating, a 125 mm focal length camera lens and a CMOS ASI533MM camera. This configuration is used to acquire the spectra of stars with a high resolving power (R), here R > 12000 (R = wavelength / spectral sharpness at that wavelength - see below).
Reminder: the resolving power R is a dimensionless number, calculated by taking the ratio between the wavelength and the finest spectral detail revealed at this wavelength. The larger R is, the more fine structures the spectrograph shows. For example, announcing that the resolving power is R=12000 at the wavelength of 6563 A means that one resolves details in the spectrum of 6563 A / 12000 = 0.55 A = 0.055 nm (compare with the fineness of a spectral filter used in photography!). A high resolution power is not always required, when it is necessary to cover a large spectral range in one exposure or to observe objects of low brightness. The Star'Ex spectrograph can be easily adapted to capture spectra in a very wide range of spectral resolving power, say from R=300 to R=30000, which covers a huge range of possible subjects.
Unzip the ZIP archive into a folder on your storage system. This will be your "working" folder (or directory). The working folder will be referred to often in this documentation. Although it is not strictly required, it is recommended that you create a separate such folder for each observation session. In the example we assume that the path to the working folder is: d:/starex213 (but remember that you are free to choose).
Note: we like very short names for files and folders, you will notice! This way we avoid mistakes and we can find our way around better, that's our opinion. We also avoid blanks in the names, because they are not always easy to spot. We would much rather write "my_file" than "my file".
You will find 4 sequences of raw images in the starex213 archive, corresponding to the observation of 4 distinct objects, the stars:
- Altair (alpha Aql)
- QR Vul
- 12 Vul
- V2139 Cyg
Tip: see how the raw image sequences are named. First a so-called "generic name" heading, for example, "qrvul", followed by an index number in the acquired sequence. Notice the presence of a "-" between the generic name and the indices. This is a very good habit to get into, as it allows you to properly separate the object name and the rank in the raw image batch (it is much better to write at the time of observation hd123543-1, hd123543-2, ... than hd1235431, hd1235432, ...).
In this same archive, there are also important image files to reduce the instrumental bias caused here mainly by the detector. They are used to pre-process the raw images, as you would do for deep sky images if you were working according to the rules of the art. You have the "_offset" file (a map of the offset signal, made in the dark with a very small exposure time), the "_dark" file (a map of the thermal signal made in total darkness with an exposure time of 900 seconds for the elementary shots that are at the origin and a temperature of -12°C for the sensor), then finally, a sequence tung-1,... , tung-6 (raw images of the spectrum of a tungsten filament lamp realized on a table - see below).
4.1 : The observation file
The first operation to perform when processing a new session is to provide specINTI with a synthetic description of the data to be processed. To do this, from the specINTI Editor interface, open the "Observations" tab. At the top of the tab, you have a "Browse" button. It is used to select the working folder on which you will work. For example here, press the "Browse" button with a mouse click, then in the dialog box that opens, select your working directory by browsing the folders on your disk, then click the "Select Folder" button. Normally, you should end up with something like this:

We want to process our 4 objects of the night in one go (you can also process them one by one, we will see how later). The possibility to process a whole session in "batches" is one of the strengths of specINTI: everything is highly automated for this and you can go about other things while processing.
From the "Object list" line, specify the name of the objects you want to process. It is recommended here to provide names that can be identified by the SIMBAD queries of the CDS, which groups a considerable number of catalogs.
For example, in our batch of images to process, we find a sequence of 6 shots of the star Altair, with the file names (in FITS format) altair-1, altair-2, ..., altair-6. So, logically, in the area of the interface where we indicate the list of objects to be processed, we provide the name "Altair". specINTI Editor will then establish the link between the name provided and the name of the image files to be processed in the working folder. Of course, for this to work, there must be consistency between the way you define the generic name of your raw images ("altair-") during the observation and the chosen "SIMBAD" name of the object ("Altair"). This is the case here (the fact of writing in upper and lower case has no impact). This discipline makes processing much easier and reduces the risk of errors.
Other valid names (among others) for the star Altair are "alpha Aql" or "HD 187642", see the SIMBAD query below with the object name "Altair":

But in these situations you should name your image files respectively alphaAql-1, alphaAql-2, ... or hd187642-1, hd187642-2, ... (note that we avoid "blanks" in the file names, but you can add "blanks" in the SIMBAD names, as the separation between the catalog name and the catalog rank often improves the readability)
For now, just enter in the "Object List" line the official catalog names of the objects to be processed, compatible with the way we name our own raw files in the example, noting that the separator between the object names is the comma (","). So here: Altair, QR Vul, 12 Vul, V2139 Cyg. This gives:

As an experiment for the moment, click on the "Auto" button located to the right of the "Object List" line:

If you have not made any mistake, specINTI Editor will then fill in other fields in the "Observations" tab for you, in particular the number of raw images for each object, or the identification of spectral calibration files ("altair_neon-1", ...). You will often use this "Auto" button, but for the moment, we will do better by double clicking in the list box on the right on the name: "obs_nuit.yaml". specINTI Editor then completes the information in the "Observations" tab (there is now a reference to the offset, dark and flat-field files):

The title "obs_nuit.yaml" refers to a file that is already in your working folder (you will find it if you examine the contents of this folder). It is a simple text file (you can edit it with your favorite text editor), with the extension ".yaml". YAML refers to a file structure used in the computer world to exchange certain information between applications (it is a kind of "standard"). This file has been pre-filled by us. As you may have guessed, it describes our observation night, more precisely, a selection of the spectral data you wish to process. From now on, specINTI knows what to do.
4.2 : The configuration file
The second operation to perform before being able to process our spectra consists in editing the content of a new text file, also respecting the ".yaml" standard, in which you specify the key parameters of your instrumental configuration (characteristics of the spectrograph and telescope, observation location, chosen spectral calibration mode, etc.). Go to the "Configuration" tab of the specINTI Editor interface.
It is very important to understand that the information provided in the "configuration file" is specific to a given instrumental setup and your way of processing spectra. Consequently, if you do not modify this instrumental configuration from one observation session to another (this is generally the rule), you do not need to intervene on the associated file. This file is a kind of constant of your instrument, just as the diameter of your telescope does not change from one night of observation to another.
If the structure of the configuration file seems complex to you, you should know that: (1) its content will be carefully described in the following, and that the complexity is only apparent, (2) you only have very rarely the occasion to intervene in this file to modify it, we repeat.
Note: it is this file, and only this one, that is provided to the specINTI application when the processing starts. The software finds here everything it needs to reduce the spectra. But specINTI Editor hides this computer "kitchen" from your eyes, because you don't need to know these details to work (specINTI Editor, as its name indicates, is used to edit the observation and configuration files, and is also used to call the specINTI application transparently, to make your life easier).
From the "Configuration" tab, note the list on the right. This is a series of pre-defined configuration files. They correspond to instrumental situations that we will study in this documentation. These files are necessarily stored in a sub-folder of your specINTI Editor application installation folder, called "_configuration". Normally, you can ignore this kind of detail.
Note: Beware, if the "_configuration" subfolder does not exist, the specINTI Editor application cannot be launched. The directory in question is automatically created when you unpack the distribution archive.
Select the configuration "conf_starex2400_mode0_demo3.yaml" from the list on the right by double clicking on the name:

Note: you are free to name your own configuration files.
The editing area, on the left, is automatically filled. You can browse it, but don't worry about the content, you will soon master it if you continue with specINTI.
And here is the long awaited moment: click on the "Run" button at the bottom of the tab. The processing of the spectrum of your 4 objects will then start automatically.
After a few moments, specINTI Editor displays the result as small thumbnails, but you have other ways to see these spectra, and other intermediate images, as we will see later. Think of the "Png Gallery" tab that opens automatically as a quick look at the result of the processing. Here you see only a small part of the spectrum of the objects, but at very high spectral resolution (the broad line a little to the left is the h-alpha line). It is like observing a planet with a long focal length instrument: you detail the surface, but the field of view is very limited:

At the same time, specINTI has written the results as files in the working folder, which you can consult later. You can get an idea of these by looking at the contents of the "Console" window:

Note: The processed spectra are automatically saved as files in the working folder ("output file"). The names given to these files, imposed by specINTI, may surprise you by their length. For example "_v2139cyg_20220803_052.fits" (the most important file, the final spectral profile in FITS format). This name is actually very convenient. The "_" at the beginning indicates that it is processed data, as opposed to raw data. This identifier makes it easier to sort the results if you need to move them from one folder to another. Then we find the name of the object, as entered in the "Object list" field when editing the observation file. We find a new "_", then the date of shooting of the first image of the sequence in the format YYYYMMDD_FFF, with FFF the fraction of day compared to midnight.
You will notice that quite a few files beginning with "_" are written for each spectrum processed. For example the file "_v2139cyg_20220803_052.png" is a small thumbnail of the result that you can immediately paste into a message, for example. The file "_v2139cyg_20220803_052.yaml" is a simple copy of the configuration file used to process the spectrum of the object. This last data is characteristic of the practical side of specINTI: if in 6 months or two years you want to reprocess the same data, even if it means making a slight modification, you just have to re-use the configuration file previously used. This kind of re-processing is difficult to do with most software that has a complex graphical interface, yet it is essential to ensure the sustainability of your observations in the long term.
At this stage, you can of course use the "_v2139cyg_20220803_052.fits" file with third party software for advanced analysis (such as VisualSpec or ISIS), or directly export it to databases (the file header is compatible with the BeSS format).
Of course specINTI Editor itself offers display tools, for example, from the "Visu profile" tab:

Note: on the right-hand side of this tab, you will find the contents of the FITS file header displayed.
4.3 : Synthesis
The processing of an observation session involves editing an observation file, which can be filled in automatically if you organize your data correctly. This operation only takes a few moments.
As the configuration file is a constant in your equipment, you do not have to intervene on it in general.
Finally, the whole process is almost limited to pressing a button, the "Run" button. We can't say that the use of specINTI is that complex! This application proves to be a very efficient production tool, which will be forgotten quickly, the best that can happen, because the goal is finally to enjoy observing, and not to get bored with the additional tools.
Note: the software's operating principle is based on a simple text file, so you can see how interesting it is to share these difficulties with colleagues or to exchange tips. No need for illegible and messy screenshots, no hidden options in the corner of the interface. With specINTI you only need to send a simple text file of less than 1 kb, which you can open with a NotePad and which contains absolutely everything you need to share a quality reduction work.