Evaluation of Atik460EX camera use in association with eShel spectrograph
eShel is an échelle spectrograph manufactured by Shelyak instruments. It allows a resolving power of R = 11000 (recall, the resolving power is the ratio of the wavelength which is observed by the spectral width of the finer detail at this wavelength). The spectrometer is interfaced to the telescope by a 50 microns in diameter optical fiber. See here for a review of the spectrograph.
The spectrograph objective lens (chamber camera) is a Canon 85 mm focal length at f / 1.8. Traditionally, for these spectrograph the detector is the camera QSI-532 model (QSI company). In this case, the CCD sensor is the Kodak KAF-3200ME model. It has 2184 x 1472 pixels at 6.8 microns. A high value of this component is its high quantum efficiency, about 80% at 656 nm. The readout noise, very critical for spectrography performance, is of the order of 12 electrons rms. About the use of QSI-532 in the field of eShel spectrograph, see here.
The camera QSI-532 clearly identified three disadvantages:
- High purchase price;
- A sensor having a relatively high readout noise (good standard now rather than a few electrons of noise rather than the ten electrons);
- A strong lag phenomena.
One possible alternative for the detection is to use Sony ICX694AL CCD sensor. The key to this choice is that the sensor has a size sufficient to capture diffraction orders with sufficient overlap to build a full spectrum without hole. The detector is composed of 2749 x 2199 pixels x 4.54 microns. The Sony ICX694AL sensor size is slightly smaller than the Kodak KAF-3200ME (12.5 mm x 10.0 mm x 14.8 mm to 10.3 mm), but sufficient for our needs.

Atik460EX
camera interfaced to eShel spectrograph.
Relative to Kodak detector, Sony detector has the following advantages:
- Low cost. We can found this Sony sensor in the Atik460EX camera for example (ATIK company). The present test is based on this camera;
- Low read noise of about 5 electrons;
- Total absence of lag;
- No mechanical shutter (interline sensor structure with an electronic shutter function).
In contrast, the quantum yield at 656 nm for the Sony sensor is estimated to 65% (80% for Kodak). However, the low readout noise compensate the deficit in terms of detectivity. In addition, the blue quantum efficiency of Sony sensor is superior. See here the detailed electro-optical characteristics of these components.
In the specific situation of the Atik460EX camera, the detector is cooled by a Peltier system allows only DT = 26 ° C (for example, if the ambient temperature is 20 ° C, it will not be easy to reach the detector temperatures below -5C). Fortunately, the rate of thermal charge is relatively low in the Sony sensor.
The native pixel size in the Atik460EX is small (4.54 microns). If the spectrum is acquired in 1x1 binning mode, it is highly oversampled. Also, this acquisition mode guarantee of good spectral and photometric restitution (calibration). It is a bonus. But the full efficiency of this camera really expresses when used in 2x2 binning (the collecting surface of the pixel is then multiplied by 4, while the noise reading is unchanged). Size of "virtual" pixels (or binned pixel) in this case is 9.08 microns and sampling of the spectrum is about 0.18 A/pixel in the red (0.12 A/pixel in the blue). The FWHM (full width at half-height) of a monochromatic line is about 3.2 pixels at 656 nm, above the critical Nyquist sampling (2 pixels FWHM). The 3.2 pixels sampling per FWHM is quasi-optimal in terms of the signal to noise ratio performance.
The difficulties inherent in this camera choice are ultimately:
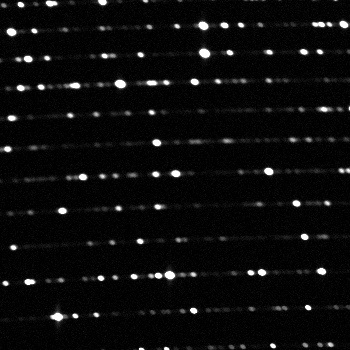
- orders traces very narrow, of the order of 4.5 pixels along the vertical axis of the image. This forces you to be very careful when correcting the instrumental response (blaze function correction). You really associate a set of calibration images for each observed object with a short time between shots to reduce temporal drifts of the spectrograph (thermoelastic effect). The challenge is to restore a good continuum (with good relative photometric accuracy).
- The inter-order gap is only about 17 pixels in the red. This does not facilitate the evaluation of inter-order black signal when processing spectra.
The good news is that the pixel fill factor is probably pretty basic approaches 100% despite the organization interline sensor. The probable reason is the presence of effective microlens. It was feared structural noise spectral profiles generated given the huge distortion in the spectral images of departure. There is nothing and this is an important result of this test.
|
|
|
|


|
|
The question of optimal binning factor is important (bin 1x1 or 2x2). Unquestionably, the 2x2 binning gives the maximal detectivity if we consider only readout noise (gain of 1.4 in SNR relative to 1x1 binning acquisition). The FWHM of a monochromatic line is close to 3 pixel by using binning 2x2. This is a correct sampling, close to the optimum (3.2 to 3.5 pixels) in terms of detectability (remember that the minimal required sampling is of 2 pixels per FWHM). But correction of cosmetic defauts (cosmic rays, hot pixels) is more difficult in binning 2x2. Processing noise can be also more present (induced by geometric distorsion correction algorithm). Butn this spatial noise generated by ISIS seems low, including 2x2 binning operation mode. You need to evaluate for yourself the best result by trials (the result may depend on your observation conditins and the method of data reduction).
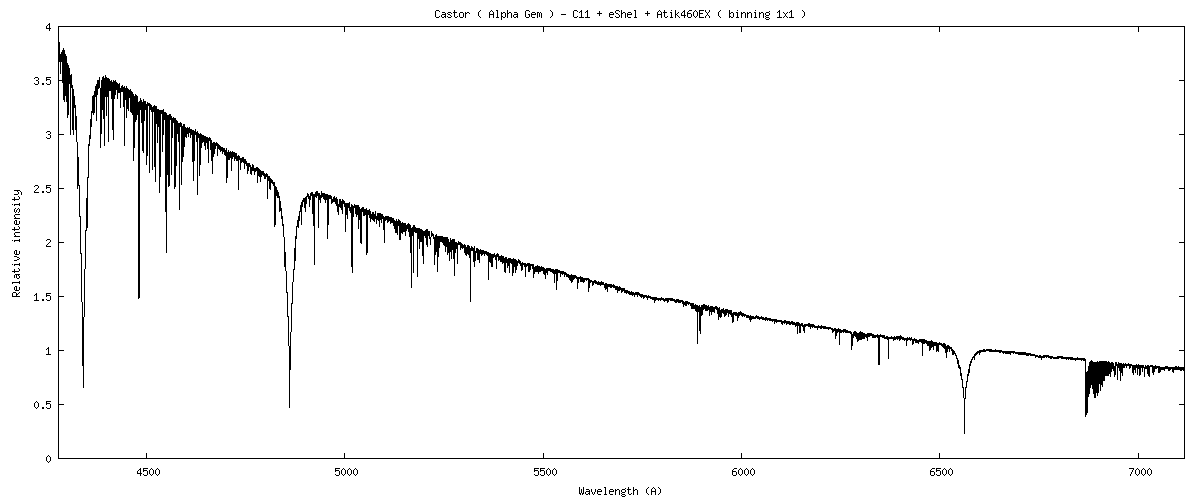
Spectrum of star alpha Gem obtained by using binning 1x1 mode. Note that ISIS connects very well different orders in a single spectrum.

Another example eShel spectrum of hot star (Regulus) made with the camera Atik460EX in 1x1 binning. The photometry of the continuum is restitued, with a natural look.
The following images are raw images of the 28 Tau star spectrum observed with different instruments, but with the same exposure time:
|
|
|
|
|
|
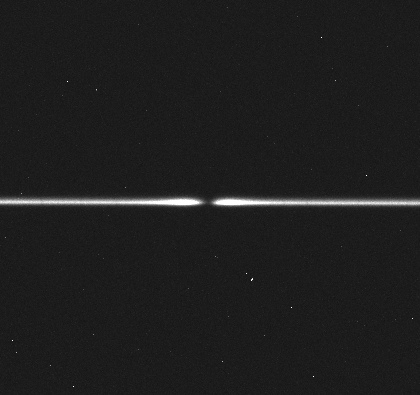


Spectra on the left and on the right in this figure were made with the same telescope and the same CCD camera. At left, the Lhires III spectrograph operates at its maximum resolution (R = 17000) and right, the spectrograph is a eShel at R= 11000. Apparently, the measured signal appears neighbor in both cases (10800 ADU and 9300 ADU respectively). However, the sampling of Lhires III spectrum is 0.12 A/pixel and 0.18 A/pixel for the eShel configuration. So, finally Lhires III spectrograph showed 1.7 times more signal. Beware though, this type of comparison is fragile because potential errors. Depending on the seeing (turbulance) or atmosphere transmission, the result may strongly varied (a factor of two is not surprising). In this analysis, for example, the spectrum acquired with the eShel + Atik460EX was conducted under relatively poor in terms of seeing - it be possible to do better.

Comparison of the
spectral profile of the 28 Tau obtained with the three instruments
described above. The processing is performed with the ISIS software.
Basically,
the apparent signal to noise ratio is similar for the three examples.
For comparison, it should be noted that the spectral resolution of Lhires III 2400 l / mm spectrograph is substantially higher than the other two, which handicaps in terms of signal to noise ratio. If the spectral resolution of Lhires III is certainly higher, here, the spectral coverage of the eShel spectrograph is much higher as shown in the following graph:
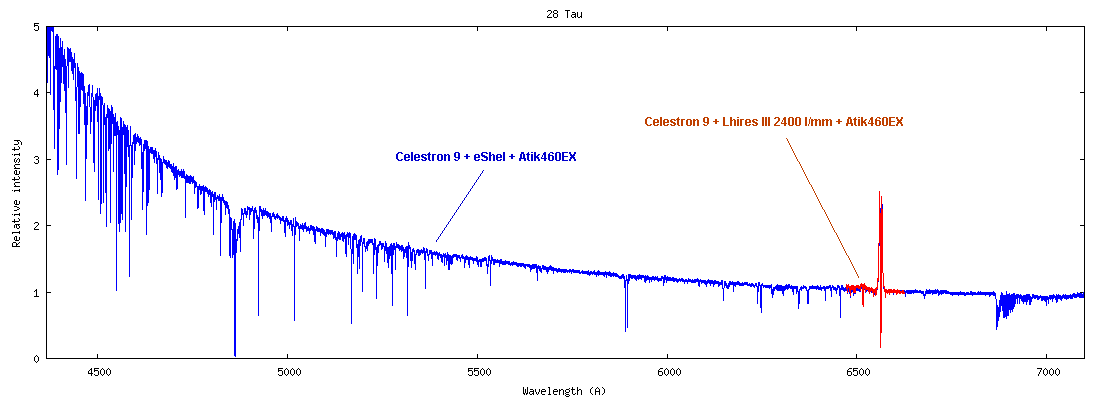
Comparison of the full spectra recorded with eShel and Lhires III 2400 l/mm.
The following graph shows the performance comparison between Lhires III 2400 l/mm and eShel with the same telescope (C9) and the same camera (Atik460EX) on a faint object, AZ Cas (more details here about the star), R magnitude = 8.2 and V magnitude = 9.4. In both cases, the cumulated exposure time is 2 hours and the observation is made on the same night.
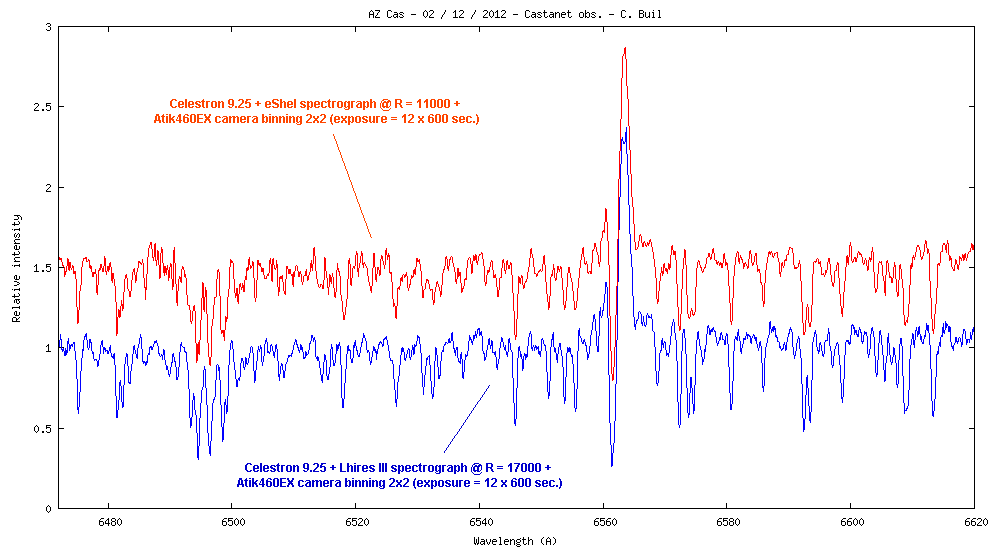
Spectrum of the star
AZ Cas taken with a Lhires III at R = 17000 and with an eShel at
R = 11000. In both cases,
the camera is an Atik460EX model (CCD
temperature -10°C with Lhires and -5°C with eShel). The performance
of eShel + Atik460EX association
is honest despite the weakness
of the star. We must also emphasize the smallness of the telescope
(D = 235 mm).

eShel
spectrum of AZ Cas taken by using a Celestron 11 (D = 0. 280
m) and an Atik460EX camera in 1x1 binning mode (8 x 600 sec. exposusre
time).
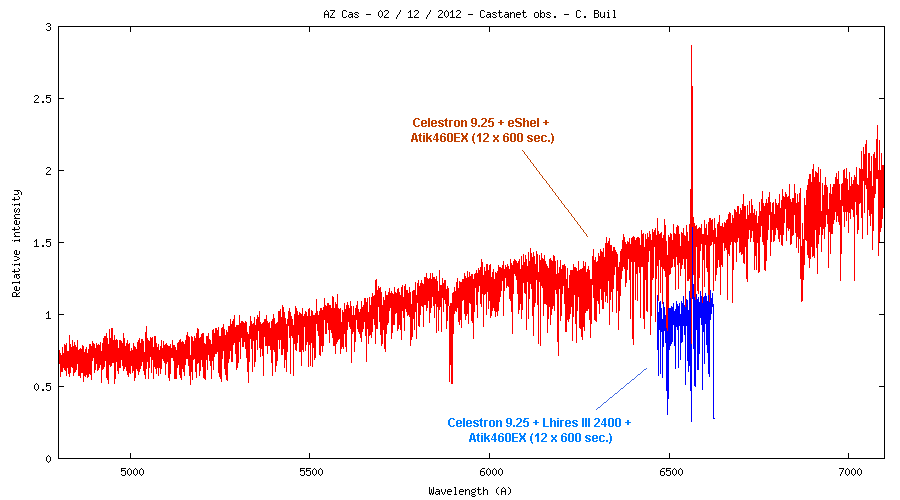
Full spectrum of AZ Cas observed with a spectrograph Lhires III and eShel 2400 the December 2, 2012.
Here, some key parameters for compute detectivity for 3 Atik460EX cameras (you can evaluation dispersion in function of the serial number) - the measure prtocol is described here :
Atik460EX - serial number 31229-60
|
Temperature |
Gain |
Readout noise |
Thermal charges rate |
|
-5°C |
0.266 e-/ADU |
5.4 e- |
0.0028 e-/s |
|
-10°C |
0.265 e-/ADU |
5.3 e- |
0.0008 e-/s |
|
-20°C |
0.265 e-/ADU |
5.3 e- |
0.0002 e-/s |
Atik460EX - serial number 31241-90
|
Temperature |
Gain |
Readout noise |
Thermal charges rate |
|
-5°C |
0.264 e-/ADU |
5.2 e- |
0.0034 e-/s |
|
-10°C |
0.263 e-/ADU |
5.1 e- |
0.0011 e-/s |
|
-20°C |
0.263 e-/ADU |
5.0 e- |
0.0004 e-/s |
Atik460EX - serial number31245-99
|
Temperature |
Gain |
Readout noise |
Thermal charges rate |
|
-5°C |
0.280 e-/ADU |
6.1 e- |
0.0027 e-/s |
|
-10°C |
0.279 e-/ADU |
5.8 e- |
0.0007 e-/s |
|
-20°C |
0.276 e-/ADU |
5.3 e- |
0.0007 e-/s |
In conclusion, an eShel spectrograph equipped with an Atik460EX camera model appears as an option technically valid and effective.