|
||||
![]()
From a spectrum image to scientific data and measurements, line identification or spectral type comparison, there is a need to guide the user through all the processing steps. Visual Spec will become your spectroscopic assistant.
![]()
![]()
![]()
![]()
![]()
![]()
![]()

To go from the spectral image up to a fully corrected and identified spectrum what are the required steps ?
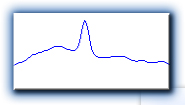
![]() A spectrum is a representation of the light curve in each wavelength. There is no need to keep working on the image itself so the first step will be to convert the spectrum image into the profil spectrum
A spectrum is a representation of the light curve in each wavelength. There is no need to keep working on the image itself so the first step will be to convert the spectrum image into the profil spectrum![]() The challenge then is to model the dispersion law so that each pixel could be converted into a wavelenght. This requires some early line identification to graduate the spectrum profil in wavelength
The challenge then is to model the dispersion law so that each pixel could be converted into a wavelenght. This requires some early line identification to graduate the spectrum profil in wavelength![]() With a calibrated spectrum you can stop here, and hunt for spectral line identification, or time to time variation. If you want to do radiometric comparison, then you will need to proceed up to the detector reponse calibration and why not remove the atmospheric line.
With a calibrated spectrum you can stop here, and hunt for spectral line identification, or time to time variation. If you want to do radiometric comparison, then you will need to proceed up to the detector reponse calibration and why not remove the atmospheric line. ![]() Finally, you can quantify some of spectrum parameters and jump into the astrophysic by measuring expansion speed, red shift, equivalent width, electronic density...
Finally, you can quantify some of spectrum parameters and jump into the astrophysic by measuring expansion speed, red shift, equivalent width, electronic density...
 To access to a preliminary "Tutorial" of Visual Spec, just click here...
![]()
From Images to Intensity curve
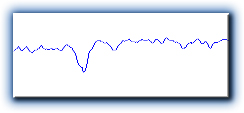
A spectrum is the decomposition of the object light per its wavelength. What is of interest is to know what is the intensity i.e. the energy the object exhibits in each of the wavelength. Having most of the energy in the blue region indicates the star is a hot, high energetic ones. If its the red region which is the most intense, then it is probably a red giant, a declining star, with a lot of possible metallic lines or molecular bands. So, to analyse a spectrum, it is better to represent the curve of its light intensity per wavelength: the spectrum profile...
![]() In a spectrum image, not all the light is concentrate on a single line. It has been spread out by the optical combinaison and the atmosphere.
In a spectrum image, not all the light is concentrate on a single line. It has been spread out by the optical combinaison and the atmosphere.
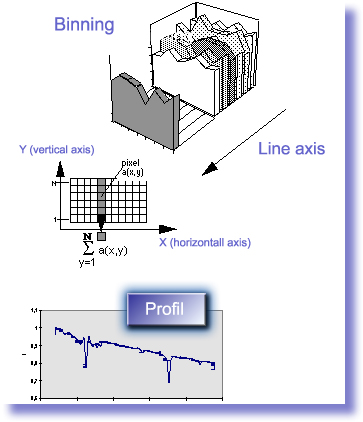
![]() To convert a spectrum image into an intensity curve each pixel which contains spectrum signal shall be added along the vertical axis. That's why it is mandatory to have it correctly aligned along the axis. This reduction operation is called the binning.
To convert a spectrum image into an intensity curve each pixel which contains spectrum signal shall be added along the vertical axis. That's why it is mandatory to have it correctly aligned along the axis. This reduction operation is called the binning.
![]()
There is a temptation to use a short-cut and to build the intensity curve with only one line of the spectrum. This works, but after having spent so much time acquiring photons, it is a pity to throw them away by considering only a small part of the recorded flux... The ability to see lines above noise is clearly dependant of the amount of signal recorded, so...
![]()

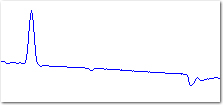
By dragging the cursor around the region of interest, you are selecting a portion the image where the binning will operates. By clicking on the binning object button, all the lines selected will be added, whatever the content of the line is. If dark lines are included, they will be added. Visual Spec will look at each line content of the entire image, and class then per their intensity average. It will then apply a signal to noise criteria which will eliminates the lines which does not bring signal enought to increase the signal to noise ratio.
![]() Visual Spec provides two ways to perform binning: the manual one, and the automatic one. It all depends of the spectrum image you are facing. In the "Start with the right Image" section, more details are given.
Visual Spec provides two ways to perform binning: the manual one, and the automatic one. It all depends of the spectrum image you are facing. In the "Start with the right Image" section, more details are given.
Manual binning
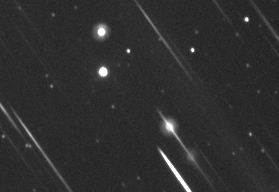
This method is mainly used when a star is very close to the spectrum. By selecting manually the area, the perturbing star can be set out of the binning region and then do not affect the spectrum profil during the addition process.Automatic Binning
This method works very well if no external object is present in the image.
![]()
As mentionned in the cover page, this site is not dedicted to "how to obtain a spectrum".
VisualSpec will process images which has an adequate presentation: Or in VisualSpec, use mouse to select the Region Of Interest before Binning operation. Avoid to have stars or other features close to the spectra. If a star is too close of the spectrum, automatic binning will not eliminate it and will include the lines in the addition. An artefact will show up at the place of the external object.
Spectra shall be aligned horizontally
If it not the case, use a standard image processing software to rotate the image until the spectra align with horizontal axis.
Why
Binning operation performes spectrum conversion by adding pixels versus the vertical axis. If spectrum is not aligned, the spectral lines will be blurred if they do not align the vertical axis.
Better if only one spectra is included
If it is not the case, use a standard image processing to crop the image to a region wich contains only one spectra.
![]()

Why
This is important when using the automatic Binning feature. The automatic algorithm checks for signal along a column and decided if the line shall be added to others to convert spectrum image into Intensity curve.