NOVA Del 2013 = V339 Del
PNV J20233073+2046041
- 2 -
|
|
NOVA Del 2013 = V339 Del PNV J20233073+2046041 |
||||||
|---|---|---|---|---|---|---|---|
- 2 - |
|
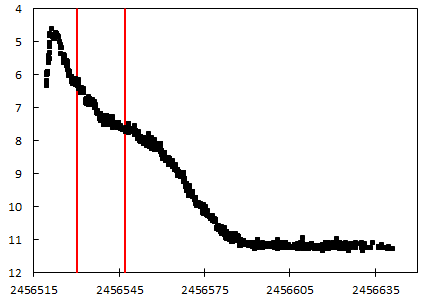
The fisrt decline - 1st part
From 27-08 to 11-09-2013From OI to N flash
Main evolutions
Strong increase of Balmer lines,
relative to continuum
Raise of [OI] lines
Appearence of NIII
sie
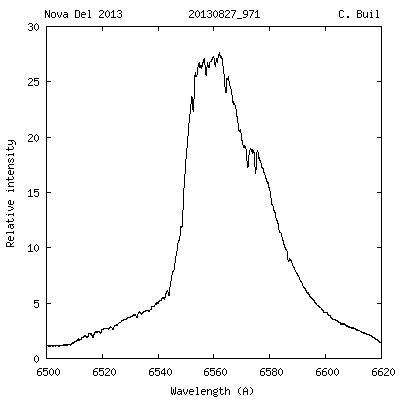
27-08-2013
Max + 11 days
Mag V ~ 6.5 ( ~ Mag V max + 2.1)
D. Antao Alpy600 R =650
C. Buil eShel R = 1000
O I Flash
H alpha H beta H gamma
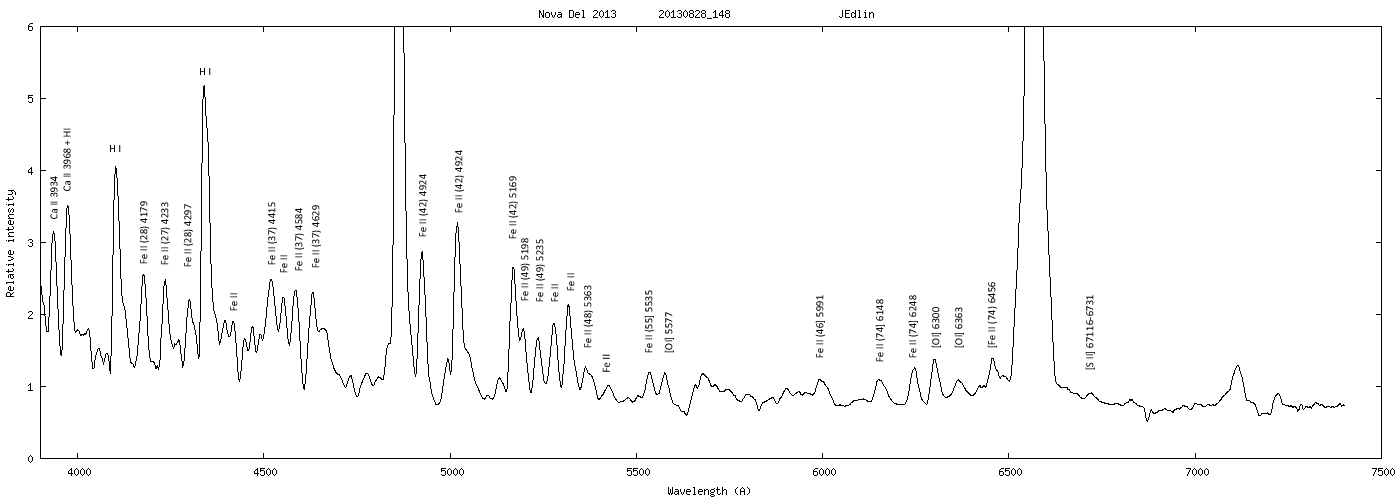
Lines identification
Spectrum : Jim Edlin
Identification : François Teyssier
About "forbidden" lines by Steve Shore 25-08-2013 Let's concentrate on atomic lines since the molecular species (in
novae) are few. The environment is usually too hot (both in a kinetic
sense and that the radiation is too hard) for their formation and
survival. Uniquely, during the opaque stage when the gas temperature
can fall below 5000 K, some radicals I've mentioned (e.g. CO, CN) can
both form and remain stable. But in general, most emission lines from
stellar sources are atomic. As a general statement, light is emitted
when an electron (or more than one if they're strongly coupled)
transitions from one state to another. A state is a specific energy
level that has an associated spin and orbital angular momentum -- or
rather a specific symmetry. You know these from orbitals in chemistry.
If the electron distribution changes, it does so by emitting (or
absorbing) a photon of the same energy as the *difference* in the
energies (to be precise, divided by Planck's constant). Only the
ground state, the most tightly bound energy that is usually taken as
the zero point of reference, is stationary. Any excited energy level
ultimately decays -- a transition to a lower state occurs in a finite
time. The symmetries are the collective result of all the electrons in
the atom (or ion), they interact electrostatically because they are
charged and at different distances from the nucleus (hence from each
other), they have spins that induce a magnetic moment (they behave like
dipoles and combine according to their relative orientations (in the
nuclear electrostatic field, spins are "up" or "down") and they also
combine depending on their orbital angular momentum (for this read
the angular pattern of the collective electron "cloud"). Different
approximations have been developed to describe these couplings, nd this
is the classification of each energy level you'll find in, say, the
NIST tables http://physics.nist.gov/PhysRefData/ASD/lines_form.html).
Within a coupling scheme, not all levels can directly couple to
others, certain so-called transition rules are obeyed. For example,
for hydrogen, the angular momentum must change by one unit in any jump
between levels, so there are states that cannot be connected by what
are called permitted (electron dipole) jumps. If this sounds
technical, perhaps it's easier to think of the analogy with an antenna.
A dipole has a particular radiation pattern. The same for a
so-called permitted transition. These are the most probably jumps
between tw levels, and hav the highest rate (highest transition
probability); for hydrogen, the rat is about 10^8 - 10^9 per second
(implying that an excited state statistically lasts for a few
nanoseconds before decaying). These will have different intrinsic
strengths depending on how the electric dipole changes in the
transition.
Any environmental disturbance, say a collision with a background
charged particle, is an impulsively varying electric field hat induces
a transition without emitting a photon. Since these occur randomly,
the lifetime has a distribution and is reduced relative to its purely
radiative decay. Thus, and the collision can also excite the electron
if the perturbing particle has sufficient energy, the excitation and
de-excitation couple the internal energy states to the background.
This is what thermal equilibrium means on the microscopic level, the
populations (the probability of the electrons being in any state)
depends only on the local temperature that determines the energy
distribution of the background charged particles (and neutrals, for
that matter). For example, an absorption can occur but if before the
state decays it's hit by a perturber, it de-excited without further
emission and the gas is heated, this is the absorption process and
happens when the gas is dense. The photons are therefore trapped
within the medium; in a stellar or planetary atmosphere this means the
spectrum will show absorption that depends on the number of atoms along
a line of sight . In a low density gas, re-emission can occur because
the level can decay freely but because the emission pattern is not
only along the line of sight there are fewer photons arrive in your
direction so the "missing" light will appear as an absorption feature.
The difference is that this scattering process doesn't heat the gas
and the process conserves the number of photons so is coherent
(hence polarized). the best example of this is the blue of the daytime sky
(although that is a molecular scattering process the process is
analogous). Both absorption and scattering occur during the first
optically thick stage of the expansion of the nova ejecta.
But there are less probable transitions, those that according to
coupling rules cannot happen by emission/absorption in a dipole mode.
These are the so-called forbidden lines because they can't be
connected by an electric dipole transition. These normally
"thermalize", their lifetimes are so long that collisions always
(except for very low densities) provoke the decay. The rate of
collision (density dependent) compared to the decay rate (intrinsic)
governs whether these lines appear. They don't in the laboratory
except under very extreme conditions (they have lifetimes as long as
seconds or more, in air in your room the collision times are
nanoseconds) but in hot, low density regions (nebulae, or the expanded
ejecta of novae and supernovae) they appear. The O I 6300 line, seen
in aurora and the upper atmosphere of planets, is a good example. It
isn't seen in the lower regions because its lifetime is about 180 sec.
But if the density falls below 10^5 /cm^3, then O I can emit in this
line. The same holds for higher ions, and the demonstration that a
region has a low density is the presence of these highly improbable
lines in the emission spectrum.
Another feature is that there are a lot of these, and from any excited
state there will frequently be other than permitted transitions
possible. Once the ejecta density drops far enough, the presence of
the central white dwarf (that provided the radiation necessary to
excite the ions in the first place) guarantees they will be observed.
Think of planetary nebular, the part that's emitting in say [O III] or
[N II] is the low density region exposed to the ultraviolet part of the
central star's spectrum that is therefore excited by absorption and
radiatively de-excited.These lines are ideal diagnostic signatures of the physical conditions
in the ejecta. If you see them at all, the density must be low
regardless of the excitation source. The hotter (harder) the spectrum
of the central star, the higher the ionization of the outer parts of
the ejecta and the stronger (relatively) the forbidden lines. This is
the stage that follows the optically thick phase of the expansion. Th
transitions are transparent (no photon trapping) so you see every piece
of the ejecta that radiates (is illuminated and has a high enough
column density to produce observable emission along your line of
sight). Since each piece of the ejecta has a outward velocity that
depends on its distance, and the differences are large, the different
parts contribute to different wavelength intervals around the line
center and the line profile is the projection of the outward motion
along the line of sight weighted by the amount of gas at that distance
from the central white dwarf.Now we come to the heart of the matter, what you see in the profiles.
Take a sphere whose velocity is larger at its periphery than interior
but whose density is lower. The highest velocity material will produce
less emission so the wings of the profile will be fainter than the
central (slower moving) part. If you have a cone (as in the resolved
HR Del 967 ejecta, the images from HST are impressive, with the
emission strongest on the boundaries, you get a different profile (one
with peaks at high velocity and a deficit in the lower radial
velocity). These saddle shaped profiles are seen when the ejecta turn
transparent. Remember, each parcel of gas emits a photon in the rest
frame of the ejecta but you, as an observer, see that Doppler shifted
by the projection of that parcels outward velocity along your line of
sight. in the sense, the line profile in the "nebular" stage is
actually a two dimensional projection of the three dimensional ejecta.
Since the forbidden lines are so intrinsically weak, and the densities
so low , the comparison between line profiles of different ions of the
same elect "maps" the 3D structure of the ejecta.
As an example, think o two lines, [N II] 5755 A and [Ca V] 5303. Th
latter is more ionized (requiring a higher energy) hence traces the
"hottest" (most ionized gas. Th N II is, instead, barely ionized. If
these two have different profiles i indicates either different
abundance distributions within the ejecta, o different excitation
conditions, or both. Comparing, say, [N II] and [O II] you can get the
N/O ratio, the same for any pair (set) of lines provided the local
conditions and ionization energies are about the same. Otherwise
corrections must be applied other measurements: you ned a way to
estimate what fraction of an element you on't see because the higher
ions don't radiate i the visible. So low resolution is needed to know
what ensemble of lines is present, and high resolution to see the
individual profiles and compare them to obtain the densities, masses of
the ejecta, and some idea of what the structure is (knots, filaments).
If you've survived to this state (I hope with some pleasure) you'll see
that the nebular spectrum (the pure emission lines with both permitted
and forbidden contributors) is the only stage at which abundances can
be determined unambiguously since it's only in this stage that you see
all of the gas. Fo Nova Dl 2013, this will likely occur in about a
month, or at least start, for the CNO ions; for F and related metals it
happens earlier because of the absorption and excitation in the UV.
The state of the gas is given by which ions are present, and the
ratios of the lines gives densities and temperatures. That's again
because the states deca with different rates depending on their
couplings. Absorption in the UV followed by emission in the visible
(fluorescence, the same thing that happens in a kitchen bulb -- the UV
lines emitted by atoms inside the tube and excited by an electric
current is absorbed by an opaque paint that re-radiates the energy in
the visible). This is he origin of the heavy metal emission lines
even in the so-called iron curtain stage and fireball, the lines are
not ever self-absorbng (photon trapping). A density and temperature
diagnostic comes from the O III lines [O III]4636/([O III] 4959 + [O
III] 5007), top line has a transition rate of about 2/sec while the
bottom pair have 0.02/s. As the density increases the pair decrease
relative to the 4363 whose decay goes to the upper state of the
4959,5007 pair.
So if this makes sense, which I hope, the next step is understanding
why the ionization varies in the ejecta but that's comparatively easy.
Every ionization produces a charged pair. The higher the density the
faster the matter recombines. The lower the UV the faster
recombination (lower ionization/removal rate)hence, while the source is
active the high ions are more in the inner part of the ejecta but that
zone expands as the density drops. If he central WD turns off, then the
peripheral layers recombine more slowly than the inner portions and
remain more ionized. In the ISM, after a supernova, this is a fossil H
II region. In novae, it's the state once the X-ray source extinguishes.
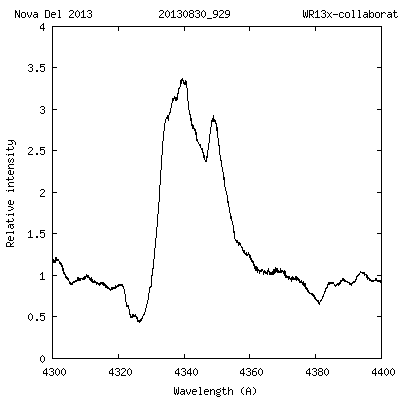
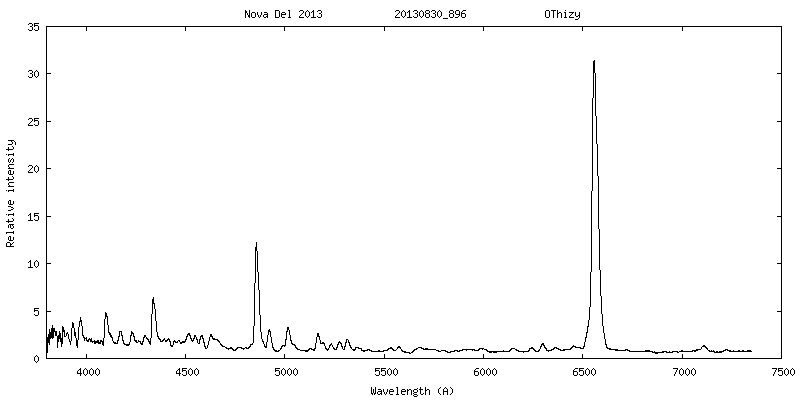
30-08-2013
Max + 14
Mag V ~ 6.8 ( ~ Mag V max + 2.5)
O. Thizy Alpy600 R =650
WR13x-Collaboration eShel R = 11000 (Amateur astronomers obsering at Teide T80
for WR campaign - Reduction : Martin Dubbs
Continued Fermi-LAT gamma-ray monitoring of Nova Delphini 2013
ATel #5342
C. C. Cheung (NRL), E. Hays (NASA/GSFC), on behalf of the Fermi Large Area Telescope Collaboration
on 29 Aug 2013; 20:39 UT... preliminary analysis shows that the nova has been continually detected by the LAT with daily-averaged fluxes, F(E>100 MeV) ~ (2-4) x 10^-7 ph cm^-2 s^-1.
H alpha H beta H gamma
Comments on spectrum evolution by Steve Shore "Thinking like a photon" First, a word of advice. In thinking about what your spectra are
telling you, it's best to "think like a photon". By that I mean think
about what a photon traversing a medium, in this case the ejecta, will
encounter and what will happen. In fact, this is the origin of the
Monte Carlo method, a technique for simulating the passage of a
particle through a very complex environment, subject to a wide range of
processes and a wide range of densities and states. You couldn't find
a better description for the ejecta. Recall that the inner and outer
parts, even were this a wind, have different outward velocities. So a
photon emitted in one place sees the rest of the surrounding gas moving
-- on macroscopic scales -- at different velocities and therefore
differently Doppler shifted. So if a photon is emitted in the outer
parts, where the density is low, it most probably escapes. If,
instead, it's emitted in the inner part, where the density is higher,
it will quite literally bounce around in both space and frequency
(absorbed in a line center, emitted in a line wing, encountering
another atom in the line core, perhaps, and being re-emitted there,
etc). So in the initial stages, where the photons are actually from
the hot gas itself, the thinning of the outer regions is like the
expansion of a wind and the photosphere (an intrinsic one) moves
inward. You see this in some of the film version of the spectral
sequences some of you have produced (especially for H-alpha). At first
the P Cyg absorption seems to move inward as the outer layers become
optically thin, and then the absorption disappears on that line
(leaving a sort of dent) as even the approaching material becomes
transparent. The higher Balmer lines, on the other hand, have a
smaller emission/absorption ratio (the emission is formed further in)
and the absorption is progressively stronger. At the same time, you
see with increasing clarity and strength the structure of the whole
ejecta, the various emission peaks, that signal the thinning of the
material at the highest distances and velocities.But don't forget the poor remaining white dwarf. It's now in the
supersoft phase, although we don't yet see that, burning the residual
material from the explosion in a source that reaches several 100,000's
K (of order 0.05-0.1 keV). The nuclear source is deep, not at the
surface, and has a photosphere of its own that depends on the newly
established structure of the envelope of the WD. This is inside the
ejecta, at this stage (as of 1 Sept) we don't yet see that directly.
But we see another, important effect: the ionization produced by this
source is gradually advancing outward in the ejecta from its base as
the ejecta thin and the photosphere moves inward. This is the
so-called "lifting of the Iron curtain" that's happening in the UV and
the cause of the decline in the optical. Progressively more of the
photons can escape in the UV without being degraded through optical or
IR transitions and the continuum temperature increases as the two
oppositely directed "fronts" approach. The individual transitions from
the ground state of neutral and low ions are in the UV and some of them
remain opaque although the continuum is increasing sufficiently to
power emission lines in the optical. Oxygen, in the form of O I, is
the best example. The [O I]6364 and 6300 lines are connected to the O
I 1302, 1304 resonance lines. The latter are still thick, so the
photons knock around and finally emerge through "open channels", e.g.
8446 and the two forbidden lines. Their presence indicates the density
is finally low enough at the photospheric depth that the emission from
forbidden line sis no longer collisionally suppressed. The transition
is abrupt in the optical, hence the term "flash" used by the early
observers, because when the right optical depth is hit, the transition
is almost instantaneous since the emission becomes local. The [O I]
line widths, you will have noticed, are lower than the wings of the
Balmer lines so this is from the inner parts. The O I 8446 was visible
for a longer time. In the UV, we would see absorption at O I
1302,1304 but that will gradually give way to P Cyg and then emission.
Something else to remember is that different elements ionize at
different energies. Oxygen, for instance, is slightly more bound than
H, so the Balmer lines will be strong when the O is still completely
neutral. Once the O (and N) start ionizing, they also contribute
recombination lines that can't decay to the ground state directly
because of the blockage of the UV channels so they emerge where they
can, at the exits marked "6300" and "6364" and so on. The same for the
C I and C II, and the N II lines. We are not yet at the point where
the N III 4640 lines appear but they will in due course.The Fe II lines are now turning completely into emission as the peak
moves toward Fe III and higher and the UV lines turn transparent. The
Fe-curtain will, once the ionization reaches Fe^+3, disappear since
that ion (Fe IV) has very few transitions in the part of the spectrum
where the UV is strongest. All of this is powering the decline of the
light curve and is what "the founders" didn't suspect: the changes in
the UV from the light curve are timed to appearances of specific ions
and transitions because the continuum temperature continually changes,
moving toward stronger UV and even XR, while the optical is a passive
responding medium. When the Lyman series turns transparent, and
becomes recombination dominated, the P Cyg profile disappears. The
same for the He I lines, they will reappear along with He II and other
higher ions as the opacity in the UV drops. Once the two fronts meet,
that's the nebular stage: the moment when the spectrum turns to
emission, we see completely through it, and the line profiles all look
basically the same. I say "basically" because density and structural
differences leave their signature on individual lines depending on
their transition probabilities (forbidden or permitted, as discussed a
while back).The nebular stage is a complicated period and very sensitive to the
specifics of the explosion. If the ejecta are spherical and smooth,
all profiles will be basically the same but differ in width because of
their "weighted depth of line formation" (in other words, recombination
line strengths depend on on density so the inner part always
contributes more, but it also depends on where in the ejecta a specific
ion appears). All of this changes quantitatively for nonspherical
explosions, but not qualitatively. The strength and velocities are
those we see projected along a line of sight through the expanding
medium.I apologize if this is staring to get heavy, it's not intended. You
have here a problem of photons (motorcycles) weaving their way through
traffic (cars, trucks) whose speeds depend on where they are in the
lane of traffic. If the ejecta are spherical the only escape is along
the direction of the flow. If aspherical, there's a way out and free
escape by swerving to the side. This is something we're just starting
to deal with in detail, and it's your work that will illuminate it even
more clearly for this prototypical nova.And as a last comment, one on the intensities/fluxes. In the next
weeks, as the ejecta change ionization and approach the sate of
freeze-out (when the recombinations are independent of the WD
illumination and depend only on the rate of expansion), we will see how
structured the ejecta really are, the density and ionization
stratification, and the abundance inhomogenities. The absolute fluxes
are the key, they tell you how much energy is in each transition and
therefore the number of radiating atoms. It seems, for instance, that
a few days ago H-alpha alone accounted for almost 8000 L_sun if the
distance is 5 kpc (less as1/D^2 depending on the distance). From this
we'll have a first estimate of the ejecta mass, one of the key unknowns
in any explosion and the pointer to the conditions at the outburst. The other is that there is structure here in the ejecta, you've already
seen that in emission and absorption, and as different ions appear that
will link to the central engine.
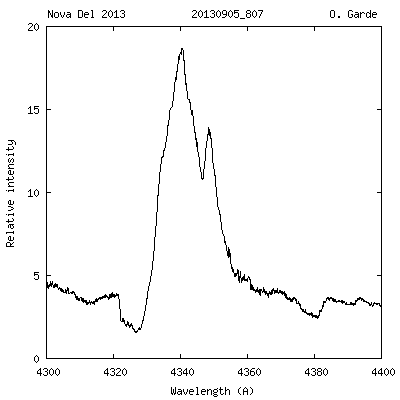
H beta line by Olivier Garde
The thinning of the outer regions is like the expansion of a wind
and the photosphere (an intrinsic one) moves inward
At first the P Cyg absorption seems to move inward as the outer layers become
optically thin, and then the absorption disappears on that line
(leaving a sort of dent) as even the approaching material becomes transparent
Nova Del 20130830_808 O.Garde - Horizontal scale : velocity (km/s)
The higher Balmer lines, ..., have a smaller emission/absorption ratio (the emission is formed further in) and the absorption is progressively stronger
Nova Del 2013 WR13x-Collaboration
[OI] 6300 and 6364 lines
The [O I]6364 and 6300 lines are connected to the O
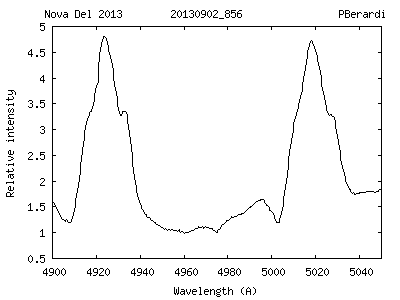
I 1302, 1304 resonance linesNova Del 20130902_856 PBerardi
Fe II 4922 and 5018 lines (multiplet 42)
The Fe II lines are now turning completely into emission as the peak
moves toward Fe III and higher and the UV lines turn transparent
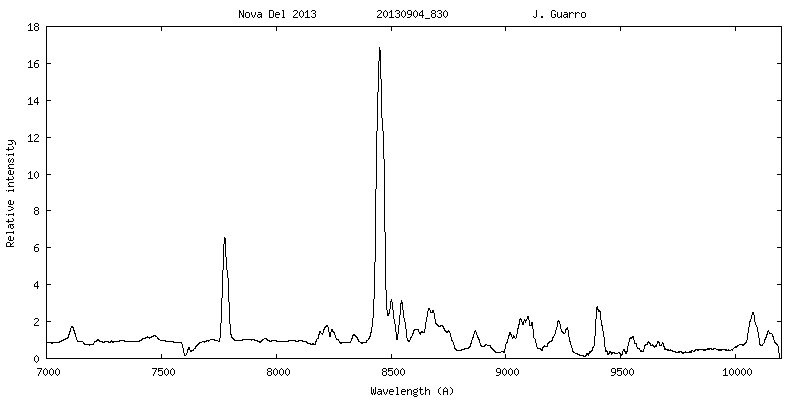
02-09-2013
Max + 17 days
Mag V ~ 7.3 ( ~ Mag V max + 3)
D. Boyd LISA R = 1000
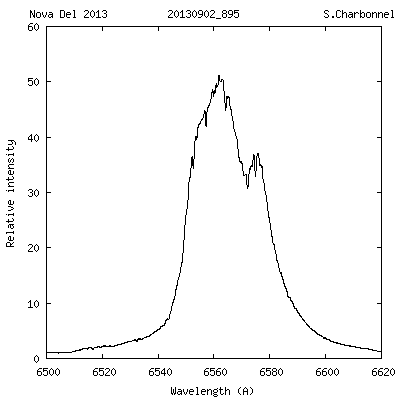
S. Charbonnel eShel R = 11000
H alpha H beta H gamma
Evolution of the spectrum by Steve Shore The beauty of this stage is that we're beginning the transition when you get to see, like a tomogram of a body, the individual parts of the inner ejecta becoming visible
First, we're nearly at the stage, t_3, where the optical spectrum
usually goes through another transition. The emission lines should
strengthen, the continuum should quickly fade, and emission lines of
moderately ionized species should appear. That's the standard
statement, that this timescale defines the nova event.But as we discussed earlier, the timing of these events is tied to the
structure of the ejecta and the evolution of the underlying WD. In
these spectra, for instance (And Christian's are also showing much of
this) there's a new feature. Look at the Ca II lines (those around
8500A). There's virtually identical structure on these lines, it's not
atmospheric water absorption as demonstrated by the [O I] and Ca II
3933. These tiny features, throughout the line profile, symmetric
about zero, are signs of the ejecta structure and the signal that these
transitions are optically thin. The lines from similar ions, or
similar ionization/excitation conditions, should be the same and you
see the same structure on a forbidden line ([O I]) as the permitted (Ca
II), from a neutral and from an ion. The ejecta geometry, if we use a
bipolar model, seems to fit a rather high inclination but it's also
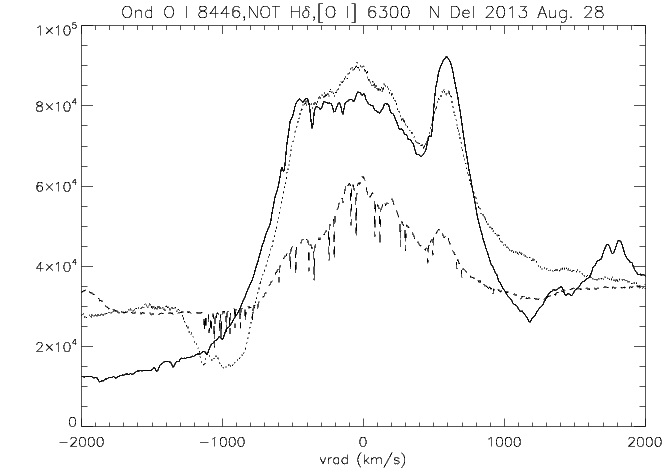
showing another effect. Notice in the second set of profiles that the
O I 8446 extends to higher velocity in the wings (like H delta) than [O
I]6300. The O I is connected to the ground transition O I 1302 in its
lower state, the upper state is fluorescent with Lyman beta, hence it
looks like H-delta and the higher Balmer lines that are weighted toward
the inner part of the ejecta. The forbidden line bleeds off the
photons from O I 1302 so it's a different profile, more like the Ca II
which are excited state transitions only. There are three of there,
one of which is nearly coincident with O I.
As the shorter wavelengths become more transparent, the profiles will
become more nearly the same. The next moment is when the UV starts to
ionize the Fe and the curtain lifts, when the [N II] 5755, 6548,6583
lines appear, and then when the [O III] 4363, 4949,5007 are excited.
The former are simple forbidden transitions, although with the same
atomic configuration as the O III. This is called "isoelectronic" in
having the same state structures (recall that N+ is the same number of
electrons as O+2 but with a different nuclear charge, that makes
relatively little difference for the binding, hence the lines are near
each other). In the ejecta, since the O I 8446 line is formed by
pumping, it's intensity varies linearly with density while the
recombination lines, like Ca II (permitted and excited states) form by
recombination so the intensity varies as density-squared. To be more
precise, and I hope less technical, the formation of a line by
recombination means that electron capture takes place so the emission
depends on the number of captured electrons (one power of density) and
the number of ions (the other power). Pumping depends only on the
number of ions to be pumped and the availability of photons, so it's a
different density dependence. Now recalling that the density is lower
in the periphery of the ejecta where the velocity is highest (in this
ejecta picture, but also for a wind), the wings are weaker but extend
to the point of invisibility. The [O I] is formed, instead, by the
1302 photons being trapped and "leaking out" and that requires the
inner region. But there's another important piece of information here,
that the forbidden transitions aren't sen if the density is any region
(for a temperature of about 10,000 K or so) is too high so there's an
upper limit (about 1E9/cm^3) for the inner part. If we take that to be
about 1000 km/s, assuming what we know from other novae, then as a
first pass guess the mass of the ejecta is about 8E-5 solar masses
(yes, you heard it first here). This depends on the filling factor
which, from the NOT observations and what you've seen in the fine
structure, suggests about 10% or 30% of the ejecta s filled with an
aerosol of filaments so this could be as low as 2E-5 M_sun.This is a normal value for the ejecta and I'm assuming that the inner
density is low enough to produce the [O I].
The calculation assumes that we're seeing this at 20 days with a
velocity of 1000 km/s for the inner part and about 3000 km/s for the
outer, fiducial numbers. It doesn't give an abundance but it's a
start. The other is that the emission at H-alpha accounts for almost
8000 L_sun if the nova is at 5 kpc and scales as (D/5 kpc)^2, so a lot
of energy is coming out in a single line.It's this last point I wanted to also mention because the ejecta are
acting as a sort of bolometer, or calorimeter. The energy now derives
from the original hot gas and the heating from the WD radiation. That
will keep up until the nova turns off, when the nuclear source
collapses and the WD starts to cool. The rapidity of this stage is
probed by the direct measurement of the XRs, which will appear shortly
if all is right here, and by the appearance of very highly ionized
species like Fe VII and Ca V, or even higher. That's still in the
future but shouldn't be very long. I haven't heard whether the gamma
ray source is still on but it shouldn't be, if the internal shocks are
the powering agent, but the radio should also turn on soon as the
ejecta turn optically thin in the centimeter wavelength range.So that's what's to come, but the beauty of this stage is that we're
beginning the transition when you get to see, like a tomogram of a
body, the individual parts of the inner ejecta becoming visible. I
don't know another stage, whether in stellar outflows (like luminous
blue variables) or even planetary nebulae (this is the last stage after
the superwind from the central star turns on) when you see the third
dimension of the universe so clearly.
OI 8446 and Ca II 8498 and 8542
O I 8446 extends to higher velocity in the wings (like H delta) than [O I]6300
05-09-2013
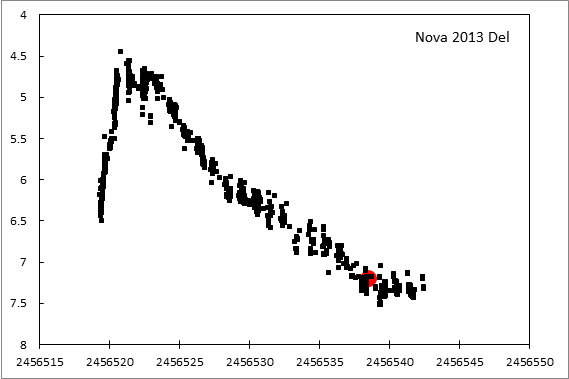
Plateau in the light curve since 02-09-2013
Max +20 days
Mag V ~ 7.3 ( ~ Mag V max + 3)
D. Boyd LISA R = 1000
O. Garde eShel R = 11000
H alpha H beta H gamma
Slow changes from night to night during this period
Evolution of the spectrum by Steve Shore
The spectral evolution may seem slow but the changes, however subtle,
are continuing. The most remarkable your data have shown is what
*looks* like emission on the negative radial velocity filamentary
structures seen on in the absorption features of the Na I D1 and D2
lines. The envelope of the absorption is seen on even the low
resolution spectra, those are comparable to the data historically
available at this stage. But in the interval between Aug. 28 and 5
Sept. the Na I features have apparently gone into emission. First,
this is very hard to understand if real, the line has not changed on
the positive velocity side at the symmetric velocity. More important,
the resonance line would normally be expected to show emission were it
scattering,and to produce these specific features the required column
densities are high. You would also, were this recombination like what
we saw in the environment of V407 Cyg, the wind of the red giant
neutralizing after the passage of the ejecta, you should also see the
connected lines of the cascade sequence, 6154.22, 6160.75. You don't.
Instead, the feature here is Fe II 6148 with a similar profile to that
seen on the other optically thin lines (compare the profile with, say,
[O I]5577A). It's more likely the onset of the helium emission stage,
the He I 5876A line. There's a detached absorption feature at -2500
km/s that appears to have shifted by about 200 km/s to the blue in this
interval that may be the same effect observed in T Pyx and Nova Mon
2012. If so, this would mean the ground state is still optically
thick. The emission-like features are at the highest velocity end of
the Na I doublet, which is -- like the Fe II multiplets around 5000 A
-- now starting to show fine structure as the line turns more
transparent with the drop in density.This variation at Na I is a really beautiful result, one that hasn't
been possible to observe before at the onset of the transition to a
fully ionized ejecta and your high cadence spectroscopy is showing all
of the rich structure of the material.One test is whether the Ca II H and K lines are also showing this kind
of change, the Fe II is linked to the complex of UV absorption features
that are now turning optically thin so the absorption will disappear on
those and signal the lifting of the curtain. There is a hint of
emission at He II 4686A but it's mainly the nascent N III/C III blend.
And the O I 8446 remains strong and will persist for some time because
of the pumping by the Ly-beta line. The N I 6486 line shows the same
(even water laden) profile as [O I] so the neutral part of the ejecta
is still dominant.As to the light curve, this strongly depends on the details of the
ejecta structure. Remember, we're still comparatively early in the
decline and pauses happen as the changes in ionization take place in
the dominant absorption spectral intervals. The interval from
2000-3000 A is turning more transparent while the 1200-2000A interval
is still dark. In earlier studies, mainly based on the UV sequences
for OS And 1986 (out current prototype for this nova) and V1974 Cyg
1992, the t_3 point, which we're at now, is when the mean optical depth
is of order unity, meaning the drop in the optical that's being powered
by the UV redistribution is almost at the critical point for the
ionization wave to start. This should be signaled by the changeover
from Na I to He I and the so-called helium flash.
Na I D region
what *looks* like emission on the negative radial velocity filamentary
structures seen on in the absorption features of the Na I D1 and D2 lines
He I 5876 - 02-09-2013
It's more likely the onset of the helium emission stage,
the He I 5876A line
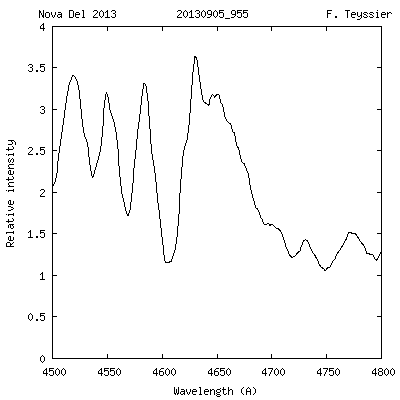
CIII/NII 4640-4660
There is a hint of
emission at He II 4686A but it's mainly the nascent N III/C III blendO I 8446 remains strong and will persist for some time because
of the pumping by the Ly-beta line
09-09-2013
Max + 24 days
Mag V ~ 7.5 ( ~ Mag V max + 3.2)
T. Bohlsen LISA R = 1000
ATel #5376
Nirupam Roy (MPIfR), Nimisha G. Kantharia (NCRA-TIFR), Prasun Dutta (NCRA-TIFR), G. C. Anupama (IIA), N. M. Ashok (PRL), Dipankar P. K. Banerjee (PRL)
08/09/2013No radio continuum counterpart is detected at the position of the nova down to the 3sigma flux density limit of 150 microJy at 1.3 GHz
ATel #5378
Continuing optical spectroscopy of V339 Del = Nova Del 2013 with the Nordic Optical Telescope and the ARAS Group
Publication in ATel#5378, Shore & al., 2013 Continuing optical spectroscopy of V339 Del = Nova Del 2013
with the Nordic Optical Telescope and the ARAS Group
Author: S. N. Shore (Univ. of Pisa, INFN-Pisa), K. Alton, D. Antao,
E. Barbotin, P. Berardi, P. Bohlsen, F. Boubault, D. Boyd, J. Briol,
C. Buil, S. Charbonnel, P. Dubreuil, M. Dubs, J. Edlin, T. de France,
A. Favaro, O. Garde, K. Graham, D. Greenan, J. Guarro, T. Hansen,
D. Hyde, T. Lemoult, R. Leadbeater, G. Martineau, Y. Buchet, J. P.
Masviel, J. Montier, E. Pollmann, J. Ribeiro, O. Thizy, ,J.-N. Terry,
F. Teyssier (contributing participants, ARAS)
Queries: shore@df.unipi.it
Posted: 9 Sep 2013; 04:22 UT
Subjects:Nova, StarSince our first report (ATel#5312) we have been continuing nightly, almost hourly spectroscopic observations of V339 Del = Nova Del 2013 = PNV J20233073+2046041).
Here we report the state at approximately the t_3 point in the photometric decline (see also ATel#5370). Spectra have been obtained with the 2.6 m Nordic Optical Telecope FIbre-fed Echelle Spectrograph (FIES) (R ~ 67000), the Ondrejov Observatory 2m Zeiss coude spectrograph (R = 18000), and a variety of grating and echelle spectrographs of the ARAS group with resolutions ranging from 580 - 11000. The ARAS spectra (565 between Aug. 14 and Sept. 7) are publicly available at the consortium website; a major development is that now spectrophotometrically calibrated spectra are also included using standards and photometry. The Balmer absorption components are still present on H-gamma, H-delta, Fe II 5018A, Ca II H and K. On the NOT spectrum from Sept. 8, the components Na I D1 and D2 at vrad ~ -1200,-900,-700 km/S with many fine omponents on both doublet members (widths of < 100 km/s); since roughly Sep. 2 these have appeared against an increasingly strong Na I emission line (with possible He II). The components on Fe
II 5018 are more distinct: -1275, -1200, -970, -890, -830. The Na I D line now shows a complex absorption trough, possibly with components of both the D1 and D2 lines at -850 and -600 km/s. The [O I] 5577, 6300,
and O I 6354, 8446 emission remain among the strongest lines in the spectra from Aug. 18 on. An strong, isolated absorption line at 5826A is compatible with Fe I 5052A. In the red, a previously un-noticed feature appears at 6726 that we identify with O I that showed a detached absorption on Sep. 18 that subsequently disappeared. The same is found for a line at 7115 that we identify as C I; an absorption component was present until Sep. 22 at -500 km/s. The structure is compatible with bipolar models with 2:1 or 3:1 axial ratios and moderate (45+/-20 degree) inclinations but this remains preliminary.Interstellar absorption is detected on Na I and Ca II strongly at -4.9, +1.1, with weak features at +19.2, and +31.7 km/s (uncertainty ±0.1A).
Interstellar DIBs, Na I, and H I 21 cm measurements along the line of sight confirm the low extinction (E(B-V) ~ 0.18) (ATel #5297). Absorption is detected at CH+ 4232A at the main Na I and Ca II velocities. There is no detectable CH 4300A. CN 3883, 4216 never appeared in the spectra during this reporting period.The changes are now relatively slower than during the first two weeks.
The lack of He I/II and any higher ions (no N II, C II at this writing (the only ions are Fe-group, no [N II]) indicates that the ejecta remain optically thick in the UV and may explain the lack of radio emission.
All emission lines show the same multiple-peaked line profile. On Aug. 28, the integrated flux (3600 - 7400A) was approximately (2.7+/-0.1)E-8 erg/s/cm^2; on Sep. 8 it was (2.3+/-0.1)E-8. The last, corrected for E(B-V)~0.18, is 4.1E-8 erg/c/cm^2.We will continue to follow this nova with this dense coverage for as long as possible with the small telescopes, and continuing observatons are planned for the NOT and Ondrejov.
ARAS database for Nova Del 2013: http://www.astrosurf.com/aras/Aras_DataBase/Novae/Nova-Del-2013.htm
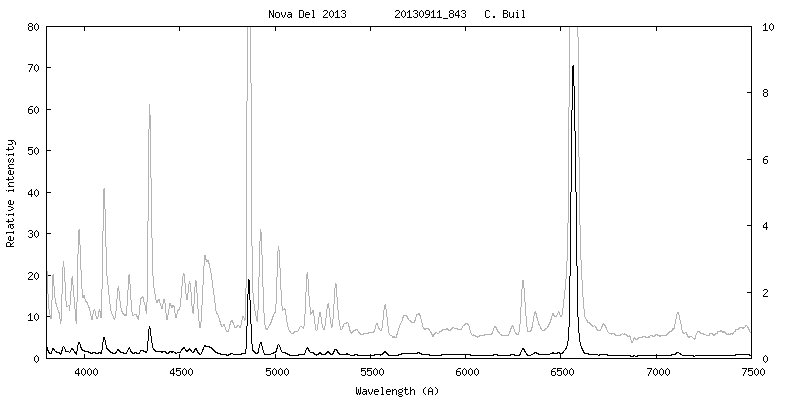
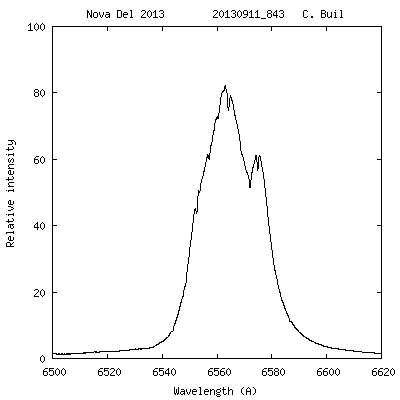
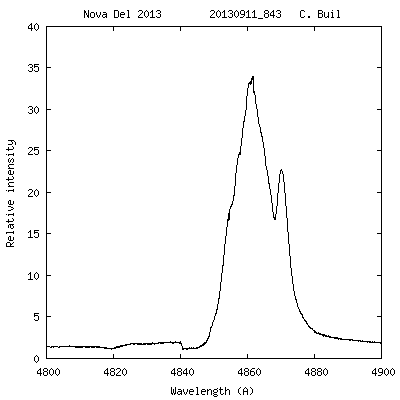
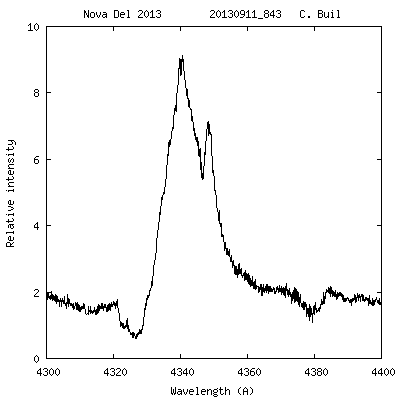
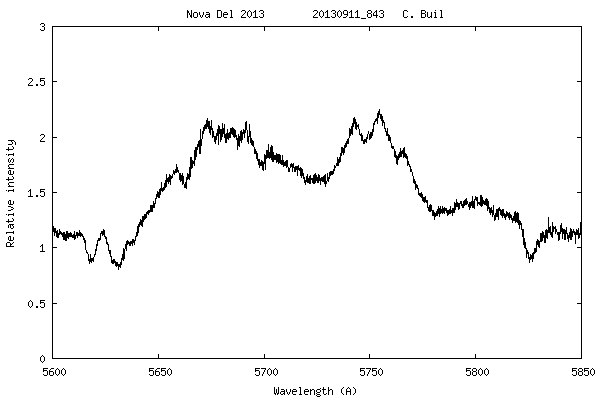
11-09-2013
Max + 26 days
Mag V ~ 7.6 ( ~ Mag V max + 3.3)
C. Buil Alpy600 R = 600
C. Buil eShel R = 11000
NII Flash
H alpha H beta H gamma
Development of NII 5678, [N II] 5755 CIII/NIII blend 4640-4660
Next Page : the first decline - 2d part
____________________________________________________________________________________________________________________________________________________________
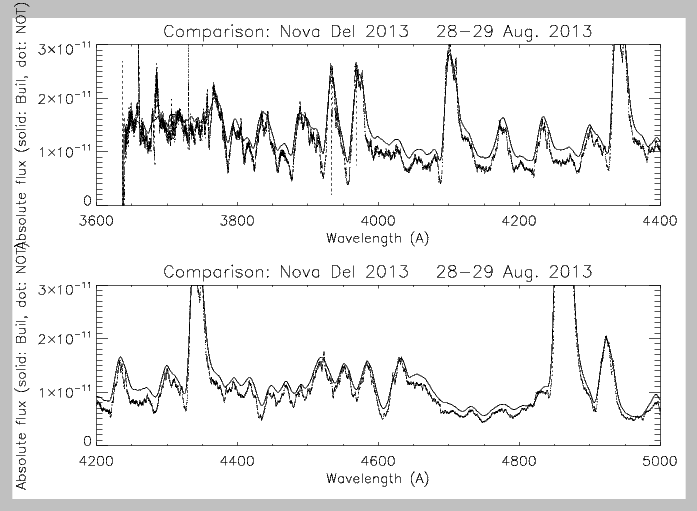
Absolute flux calibration
Spectrophotometry with a standart by C. Buil and comparison with NOT spectrum
Comments from Steve Shore
As far as I can see from the comparison, the fit is truly
superb. The difference in methods accounts for the slight (very
slight) discrepancies, some of which are simply the difference in
calibration standards. Keep in mind that I'm using a very high
resolution spectrum of the standard and there are bound to be small
(order 10%) differences (systematic) between the spectra at the
extremes where the photometry isn't as well defined. We're also
working through very different atmospheric conditions (you see that in
the far red part of the spectrum) but this is fantastic. Also, and you
should keep this in mind when we're doing such comparisons, some of
this is the result of the FIES spectra using fibers and there are bound
to be small differences, also issues of resolution enter (e.g. Na I
5889,5895) but this settles the matter. The calibrations work and the
spectra are now a resource that surpasses even the SMARTS compilation.
The same will be true for all of your campaigns -- Be, LBV, WR,
whatever. Using absolute fluxes will make it possible to address
questions that have remained open in the literature for decades because
nobody working in many of these fields has done this.For example, the most dramatic results will be achieved for symbiotic
stars, to measure the absolute luminosities of emission lines even when
the continuum of the companion varies.
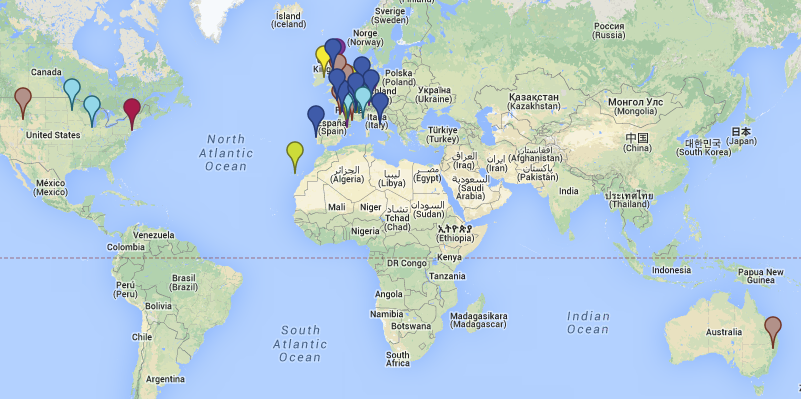
List of observers (07-09-2013)
K. Alton P. Dubreuil D. Hyde D. Antao M. Dubs T. Lemoult E. Barbotin J. Edlin R. Leadbeater P. Berardi T. de France J.P. Masviel T. Bohlsen A. Favaro J. Montier F. Boubault O. Garde E. Pollmann D. Boyd K. Graham J. Ribeiro J. Briol D. Greenan O. Thizy C. Buil J. Guarro J.-N. Terry S. Charbonnel T Hansen F. Teyssier WR13x-collaboration
Right figure - Map of Observers
(An Olivier Thizy's production)
Next Page : the first decline - 2d part
| Page built by François Teyssier - 26-12-2013 |
|---|