|
|
|
Ionospheric Perturbations
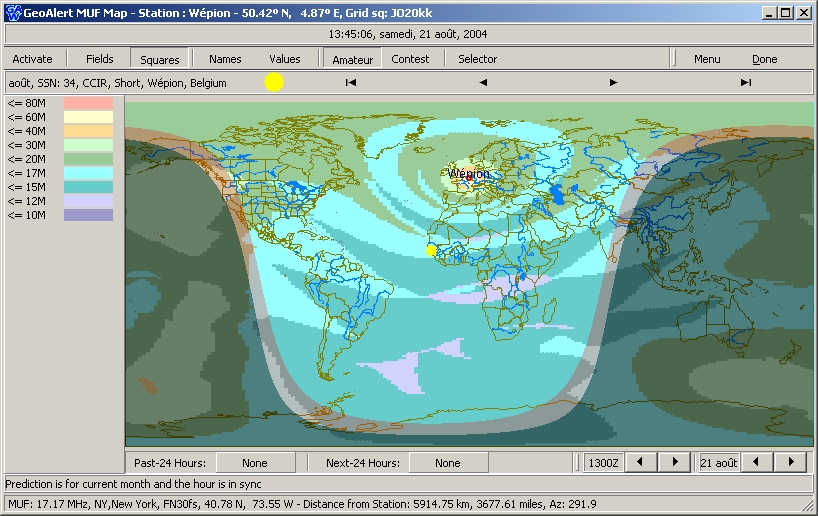
MUF and LUF (VI) MUF and LUF stand respectively for Maximum and Lowest Usable Frequency. These two values define the maximum usable spectrum range in which propagation is open, allowing HF communications, what could be the other perturbations or conditions. It doesn't tell thus all the story as many other "system" factors affect the propagation of sky waves (all parameters that characterize a communication circuit between two stations like the emission power, antenna gain, takeoff angle, QRM, S/N ratio, etc). The MUF represents the statistical frequency during which a 3000 km-single hop refraction via the F2-layer is generally open 50% of the time. This is thus a median value. That means that you have a 50-50 chance to work in the specified conditions. That means also that sometimes you will only have 1% of chance to work up to that frequency, at another occasion 100% of chance to work it, but nobody can tell you what days are the best. The MUF only tells you that in average 15 days per month the higher frequency will be open as predicted. Frequencies well below the MUF are affected by the D-layer that shows a strong absorption while the E-layer reflect shortwaves back to earth more often than expected. Above the MUF your chance to make contacts are almost null. Due to their high frequency, sky waves are not more reflected by the F-layers (F2 or F) and escape into space. Using sky waves it is thus impossible to work on frequencies too away below or above the MUF. The Highest Possible Frequency, HPF, is the upper usable limit exceeded 10% of the time, or 3 days per month, or say in other words, in exceptional conditions. During the 90% of time we use the Frequency of Optimal Transmission (after the French words), aka FOT. It is defined as the statistical frequency during which the MUF can be exceeded of 85% (see below). This range of frequencies spreading between the FOT and the HPF is 4 MHz wide or larger, sometimes so wide that it include two ham bands. To know the probability to use such exceptional conditions, there is only parameter to check in propagation prediction programs : the "required reliability"of the signal-to-noise ratio (SNRxx or SN-Rel) for the specified circuit.
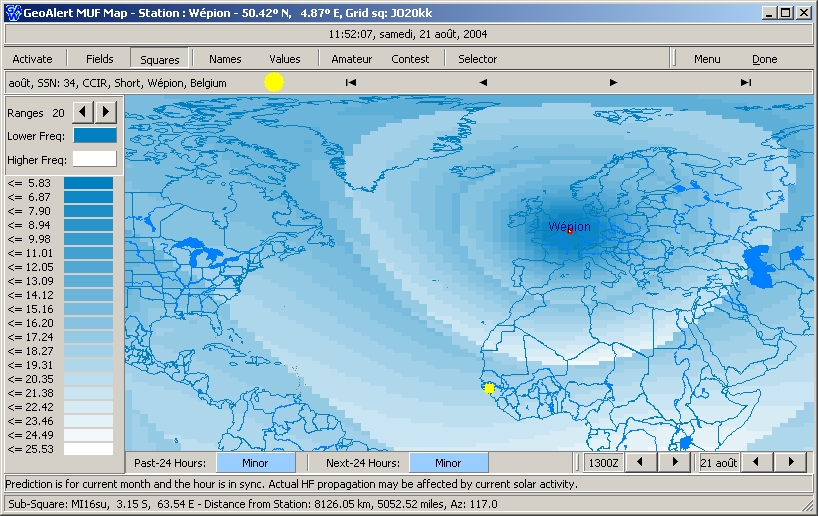
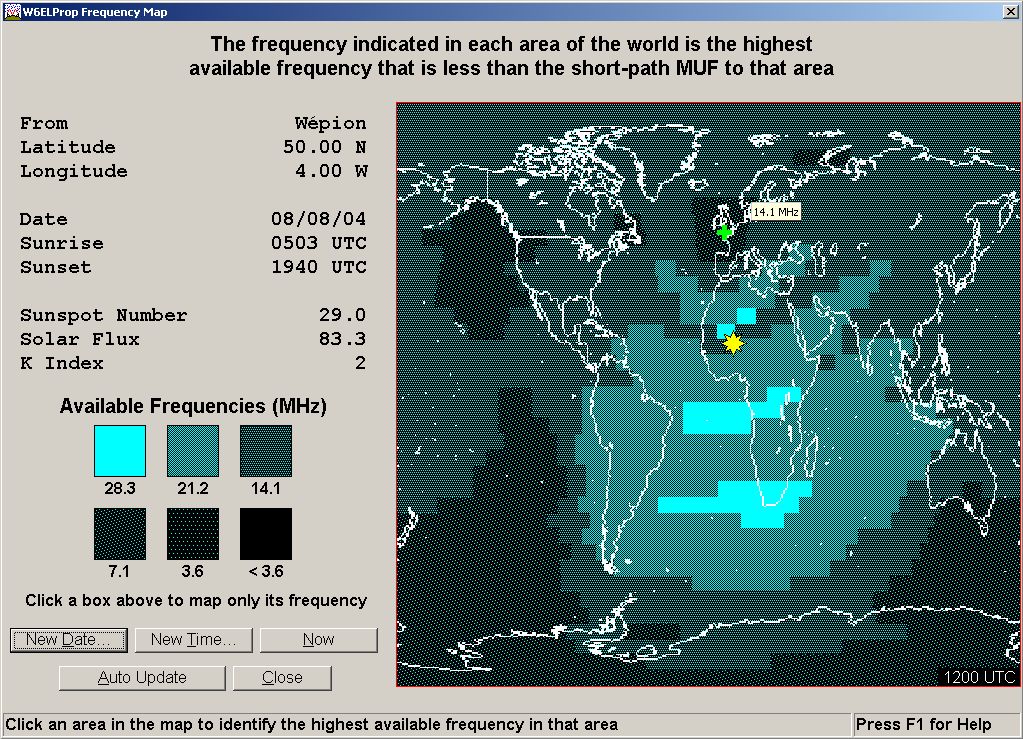
The MUF is used to define the uppermost frequency that is reflected by the F-layer at a distance of 3000 km from the transmitter. Indeed, the more ionizated are E- and F-layers, the higher the critical frequency. For example, if the absorption stops near 3.5 MHz (80 m), and the F-layer vanishes near 21 MHz (15 m), the LUF is 3.5 MHz and MUF is 21 MHz. In this propagation bandwidth the HF field strength is not altered and allows sky wave propagation. Beyond the MUF the ionosphere is transparent to radio waves. This can be an advantage from dusk to dawn for radioastronomers for example whishing to listen Jupiter storms as the level of interference is low. Refer to the radioastronomy pages for more detail. As the MUF strongly depends on the ionization level of the F-layer, during high solar activites, when the number of sunspots exceeds 200 or so, the MUF rises easily to 50 MHz at daytime. However these conditions constantly change throughout the day, with a decreasing of MUF and LUF at night often associated to deep QSB and fluctuations of the S/N ratio during tens of minutes. At the low-frequency boundary, due to the Sun presence, most radio waves are absorbed by the D-layer before any reflections may occur what drastically impact the lowest frequencies with an increasing of QRM at noon (12:00 UTC). The LUF depends also on the signal-to-noise ratio, the power and the transmission mode. This is for this reason that we also define a LUF, below which radio signals are absorbed by the D-layer and interrupt the propagation on the lower bands. The LUF can also be approximated by 0.25 x MUF with an upper limit of 12 MHz. Hopefully the lower limit usually drop below 2 MHz at night and until sunrise. If you really want to work DX stations in the low bands in these conditions, you can always use power amplifiers and high gain antennas to increase the signal against the noise of even work in CW. Of course, although your signal exceeds by far the noise level in such working conditions, you must absolutely take also in account the geometry of your communication and the radiation pattern of your antenna to expect establish a communication link. At the limits of the MUF or the LUF radio signals can be subject to fading which is a fluctuation of the signal amplitude. The highest frequency will mainly be used at daytime but it will also depend on various parameters like the time of the day, the season, the solar activity or the location of each station (geometry).
At last, a QSO will be possible at the conditions that on both sides of this circuit, the reflecting layer is at same altitude. If on the transmitting side for example the MUF is below the E-layer but if the F-layer only is effective at the receiving station, the F-layer will be too high to reflect shortwaves toward the listening station. The F-layer will attenuate (absorb) most of the signal and this ham will be unable to listen the DX station.
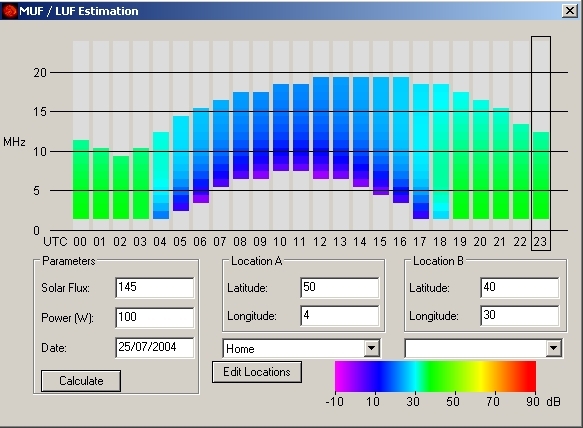
Beside the MUF we can also calculate the Frequency of Optimum Transmission, FOT, which is the frequency offering the highest efficiency path with the least multipath interferences during 85% of time instead of 50%. FOT = 0.85 x MUF. As there is no predicting chart for a frequency according to the altitude of shortwaves, amateurs can only estimate their chance to work (or to listen to) a far station in using the MUF or FOT and checking ionosondes charts like the one displayed at right that gives the status of the ionospheric layers. This map is a dynamic representation of the ionosphere, showing the variation of the ionospheric layers in altitude and density during a 24 hours monitoring. Clickk on the graph to run the GIF (635 KB). This document was recorded with the Lowell Digisonde. Other ionograms are available on NGDC website, and international ionograms on IPS website (ULCAR is no more avilable). An ionosonde provides a cross-section image of the ionosphere state much more accurate than any simulation or forecast. But a simple test can help understanding how these limits work. If you try to work or listen to a station 1000 km away in the 20 m band, there are many chances that you cannot get a QSO. Why ? Because the MUF is most that probably lower for such a short circuit. You will have a far better result working on the 40 or 80 m band.
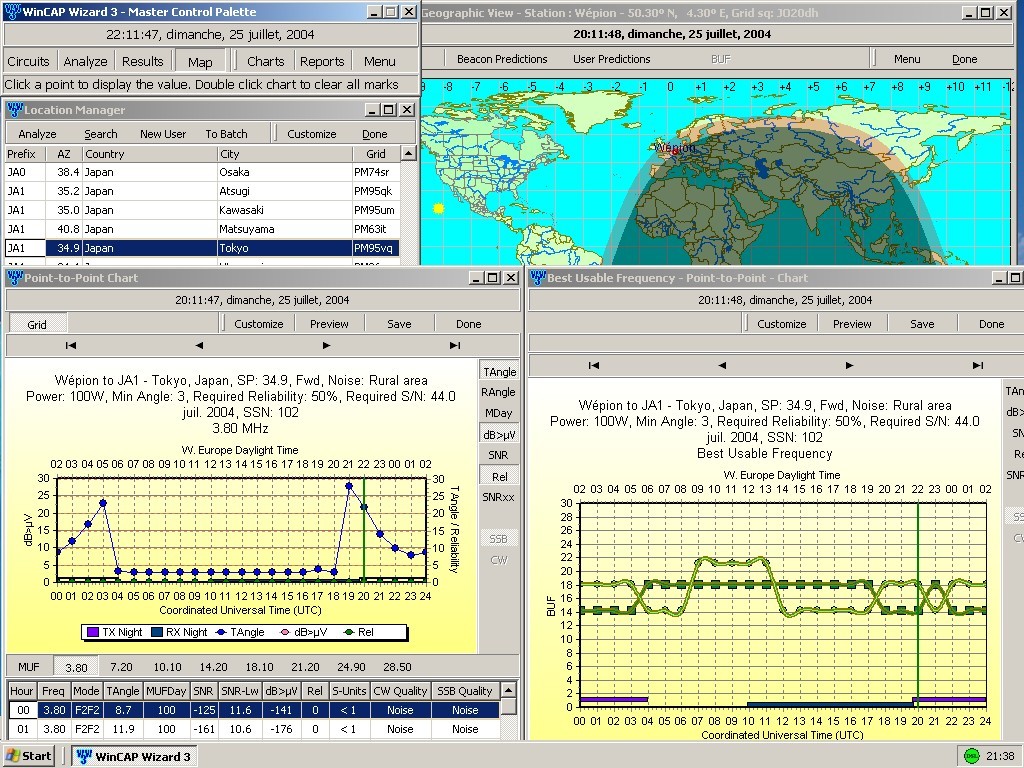
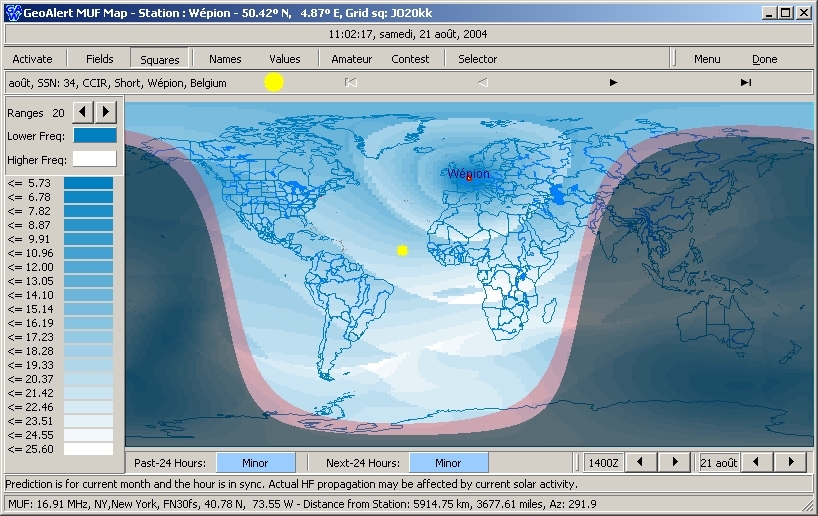
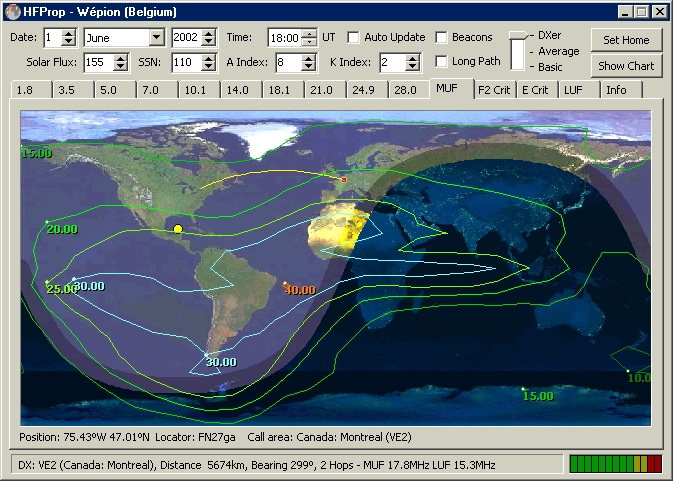
But do not compare MUF charts released by different people or applications as you have not the least idea of the way that programmers modelized their application. Some use a low resolution to speed up calculations while others interpolate data to increase the resolution without offering a better accuracy. In other cases if some charts show a opening along a specific path, another chart, using the same resolution, can show worst conditions Both predictions are thus not equivalent. If the paths can be the same between two stations, the computation of the MUF is usually different from chart to chart as not all models take into account all potential parameters, including for example the seasonal changes or more than three hops. The rms error can also be different from one model to another as well as the accuracy according the distance. Therefore if you select one chart and if it gives you accurate data, keep it, and do not compare it with another one, excepting of course if it provides a more accurate prediction for the period and the distance considered. At last, to get an accurate status of the bands activity, as we explained in the page dealing with DXing for a SWL it is always interesting to listen to beacons. They are very appreciated emitters to "feel" the propagation towards different continents. As most beacons are emitting continuously between 1.8 and 30 MHz they permit you to estimate the propagation bandwidth, MUF and LUF through all the spectrum for a given heading. Associated to a spectrum analyzer, you can immediately know what are the crowdest bands. Models of the ionosphere Now with all these solar and geomagnetic data in hand we can calculate a propagation estimation to a particular country for a specified date, time and frequency. But far from you the idea to make these calculations manually using differential equations and complex formulae. Propagation prediction programs like DX ToolBox, WinCAP, DXAtlas or PropLab Pro are here to help us in this tedious task. Thanks to these programs able to use online data in near-real-time, we can get a good estimation of propagation conditions for each hour of the day and each HF band. If you wish more information about these applications, I suggest you to read my Review of Propagation analysis and prediction programs where I list most common applications with screens dumps. Good news, most of these applications are freeware or very cheap. In What can we expect from a HF propagation model I explain also what can we expect from these tools in terms of reliability, accuracy and quality of the user interface.
Get online status The propagation being really a complex subject to study, it is not surprising that models have still need to be improved. However thanks to real-time satellite observations and the assistance of supercomputers, astronomers and geophysicists are today able to predict the evolution of the Sun and the upper atmosphere of the earth. They can draw a quite accurate portrait of the behaviour of our star and determine its influence on shortwaves, and this without interruption thanks to a continuous monitoring 24 hour a day all long the year. Most of these data are available online (see end of page). DK0WCY's messages If you understand Morse or want to learn it and in the same time being informed of the last status of the spaceweather, know that DK0WCY transmits for over 20 years in CW information related to the Sun activity and the status of the geomagnetic field. It works on 3.579 MHz between 07-08 UTC and on 10.144 MHz between 15-18 UTC without interruption. A typical message received at medium speed at 15h UTC at 10.144 MHz looks like this, once translated :
For more information Many other very interesting things could be explained about the propagation and how it affects ham activities. In a first time I suggest you to refer to my general article about radio propagation as well as in Pr. Bob Brown, NM7M's HF Propagation tutorial, a cursus given to his students at U.C.Berkeley. An Introduction to HF propagation and the Ionosphere by ZL1BPU is also a very complete and interesting document. Real-time status of solar, geomagnetic and auroral activities (on this site). Propagation Studies, RSGB. In that matter, your best sources of information are the next ones :
|
||||||||||||||||||||||||||||||||||||||||||||||||||||||||||||||||||||||||||||||||||||||||||||||||||||||


